Salvadoran vs Immigrants from Philippines High School Diploma
COMPARE
Salvadoran
Immigrants from Philippines
High School Diploma
High School Diploma Comparison
Salvadorans
Immigrants from Philippines
81.7%
HIGH SCHOOL DIPLOMA
0.0/ 100
METRIC RATING
338th/ 347
METRIC RANK
87.8%
HIGH SCHOOL DIPLOMA
1.9/ 100
METRIC RATING
243rd/ 347
METRIC RANK
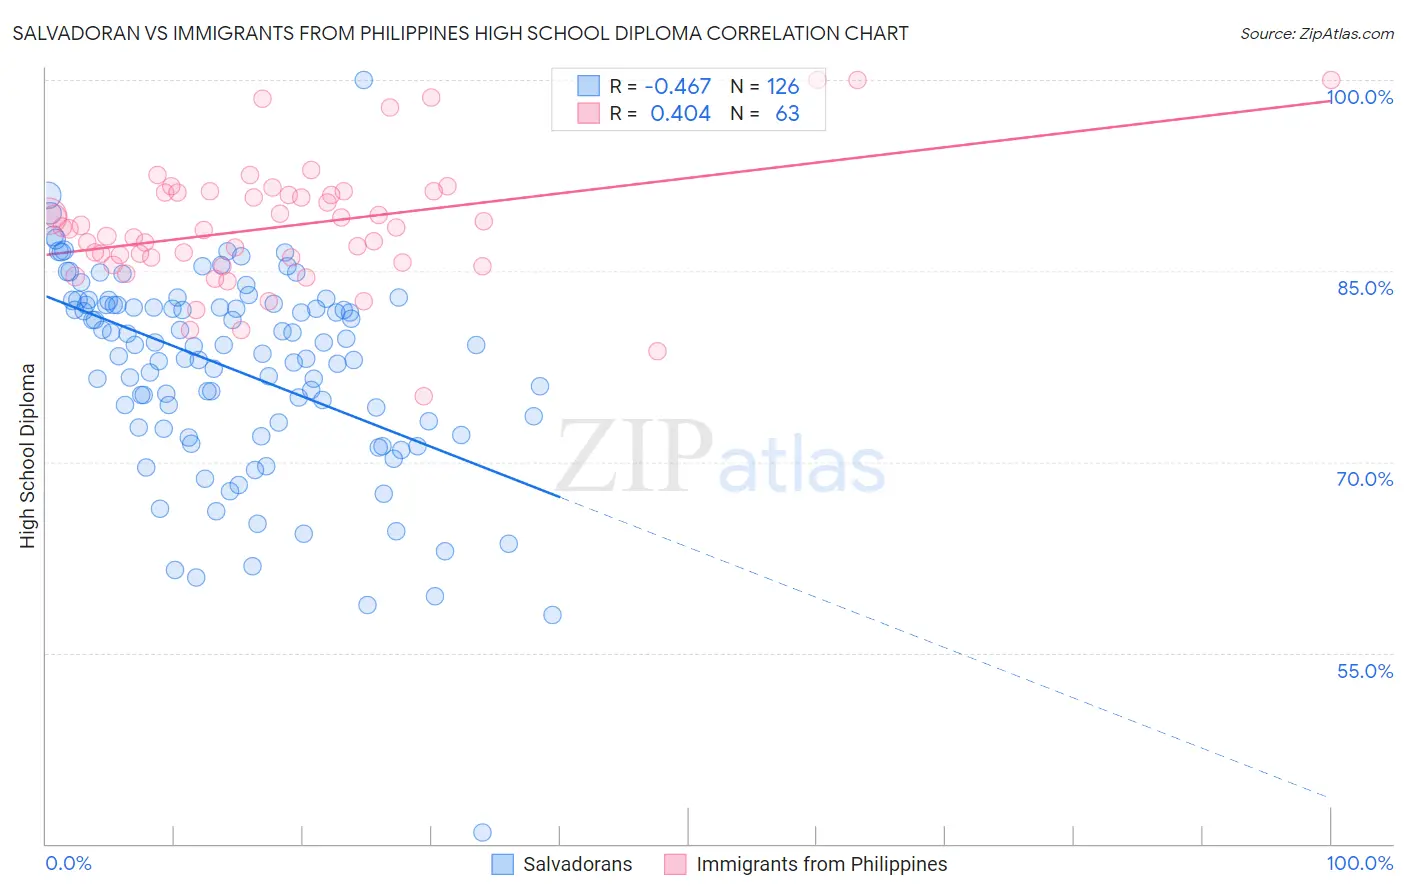
Salvadoran vs Immigrants from Philippines High School Diploma Correlation Chart
The statistical analysis conducted on geographies consisting of 399,034,198 people shows a moderate negative correlation between the proportion of Salvadorans and percentage of population with at least high school diploma education in the United States with a correlation coefficient (R) of -0.467 and weighted average of 81.7%. Similarly, the statistical analysis conducted on geographies consisting of 471,300,535 people shows a moderate positive correlation between the proportion of Immigrants from Philippines and percentage of population with at least high school diploma education in the United States with a correlation coefficient (R) of 0.404 and weighted average of 87.8%, a difference of 7.5%.
High School Diploma Correlation Summary
| Measurement | Salvadoran | Immigrants from Philippines |
| Minimum | 40.9% | 75.1% |
| Maximum | 100.0% | 100.0% |
| Range | 59.1% | 24.9% |
| Mean | 77.2% | 88.5% |
| Median | 79.1% | 88.3% |
| Interquartile 25% (IQ1) | 72.7% | 85.7% |
| Interquartile 75% (IQ3) | 82.3% | 91.2% |
| Interquartile Range (IQR) | 9.6% | 5.6% |
| Standard Deviation (Sample) | 8.1% | 5.0% |
| Standard Deviation (Population) | 8.1% | 4.9% |
Similar Demographics by High School Diploma
Demographics Similar to Salvadorans by High School Diploma
In terms of high school diploma, the demographic groups most similar to Salvadorans are Pima (81.6%, a difference of 0.10%), Immigrants from Yemen (81.8%, a difference of 0.17%), Houma (81.5%, a difference of 0.20%), Immigrants from Dominican Republic (82.0%, a difference of 0.32%), and Guatemalan (82.0%, a difference of 0.33%).
| Demographics | Rating | Rank | High School Diploma |
| Central Americans | 0.0 /100 | #331 | Tragic 82.5% |
| Immigrants | Honduras | 0.0 /100 | #332 | Tragic 82.5% |
| Immigrants | Latin America | 0.0 /100 | #333 | Tragic 82.1% |
| Tohono O'odham | 0.0 /100 | #334 | Tragic 82.1% |
| Guatemalans | 0.0 /100 | #335 | Tragic 82.0% |
| Immigrants | Dominican Republic | 0.0 /100 | #336 | Tragic 82.0% |
| Immigrants | Yemen | 0.0 /100 | #337 | Tragic 81.8% |
| Salvadorans | 0.0 /100 | #338 | Tragic 81.7% |
| Pima | 0.0 /100 | #339 | Tragic 81.6% |
| Houma | 0.0 /100 | #340 | Tragic 81.5% |
| Mexicans | 0.0 /100 | #341 | Tragic 81.4% |
| Immigrants | Guatemala | 0.0 /100 | #342 | Tragic 81.4% |
| Immigrants | El Salvador | 0.0 /100 | #343 | Tragic 80.8% |
| Immigrants | Central America | 0.0 /100 | #344 | Tragic 80.1% |
| Yakama | 0.0 /100 | #345 | Tragic 80.0% |
Demographics Similar to Immigrants from Philippines by High School Diploma
In terms of high school diploma, the demographic groups most similar to Immigrants from Philippines are Choctaw (87.8%, a difference of 0.0%), Peruvian (87.8%, a difference of 0.010%), Immigrants from Uzbekistan (87.8%, a difference of 0.020%), Cheyenne (87.8%, a difference of 0.020%), and Comanche (87.9%, a difference of 0.050%).
| Demographics | Rating | Rank | High School Diploma |
| Sub-Saharan Africans | 2.8 /100 | #236 | Tragic 87.9% |
| Taiwanese | 2.8 /100 | #237 | Tragic 87.9% |
| Sioux | 2.7 /100 | #238 | Tragic 87.9% |
| South Americans | 2.7 /100 | #239 | Tragic 87.9% |
| Comanche | 2.2 /100 | #240 | Tragic 87.9% |
| Immigrants | Uzbekistan | 2.1 /100 | #241 | Tragic 87.8% |
| Cheyenne | 2.1 /100 | #242 | Tragic 87.8% |
| Immigrants | Philippines | 1.9 /100 | #243 | Tragic 87.8% |
| Choctaw | 1.9 /100 | #244 | Tragic 87.8% |
| Peruvians | 1.9 /100 | #245 | Tragic 87.8% |
| Immigrants | Eritrea | 1.7 /100 | #246 | Tragic 87.8% |
| Immigrants | Costa Rica | 1.7 /100 | #247 | Tragic 87.8% |
| Spanish Americans | 1.5 /100 | #248 | Tragic 87.7% |
| Senegalese | 1.5 /100 | #249 | Tragic 87.7% |
| Immigrants | Nigeria | 1.5 /100 | #250 | Tragic 87.7% |