Yup'ik vs Immigrants from Yemen High School Diploma
COMPARE
Yup'ik
Immigrants from Yemen
High School Diploma
High School Diploma Comparison
Yup'ik
Immigrants from Yemen
86.1%
HIGH SCHOOL DIPLOMA
0.0/ 100
METRIC RATING
289th/ 347
METRIC RANK
81.8%
HIGH SCHOOL DIPLOMA
0.0/ 100
METRIC RATING
337th/ 347
METRIC RANK
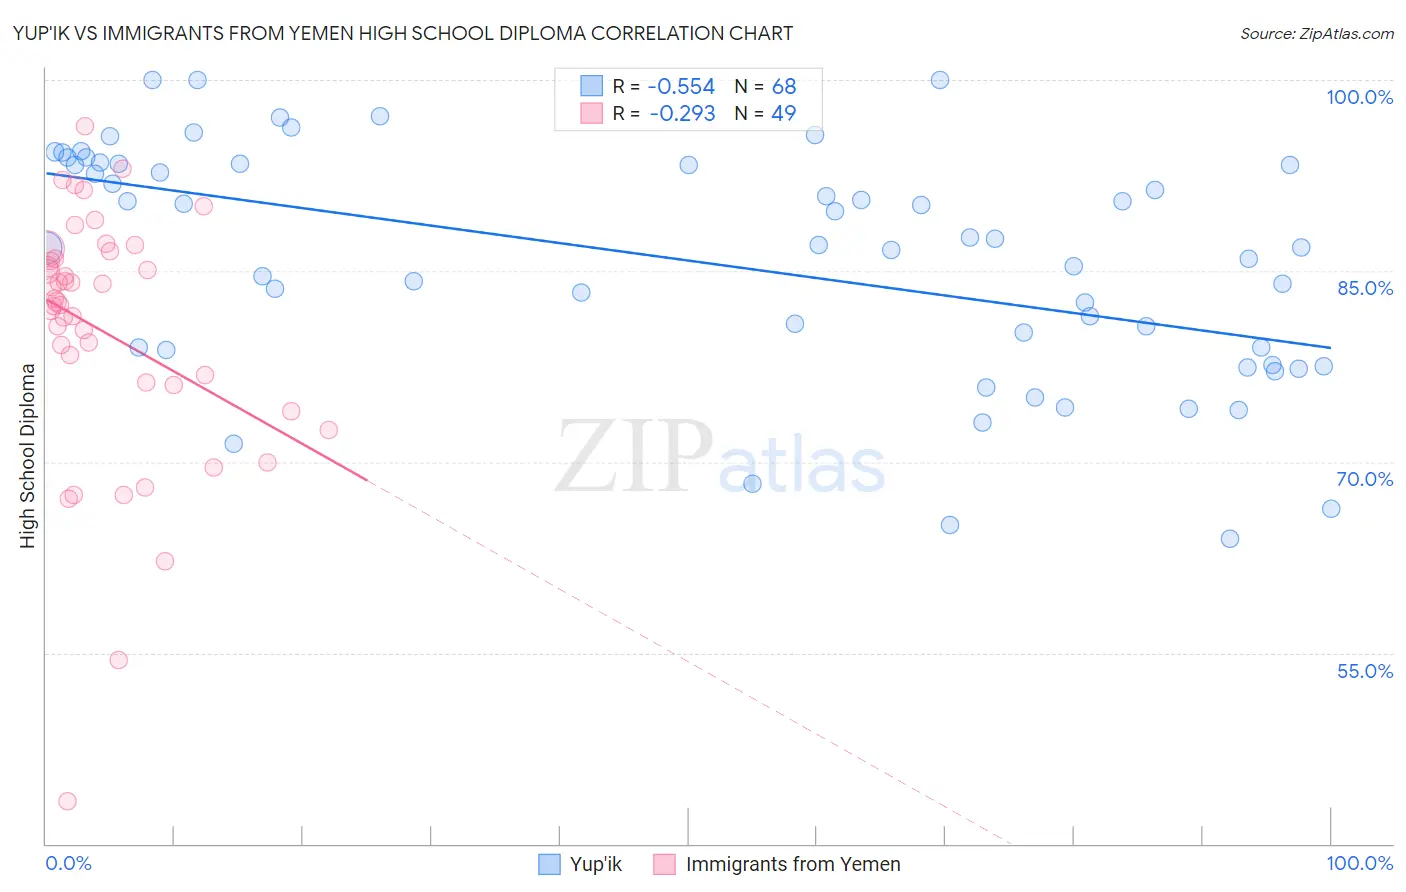
Yup'ik vs Immigrants from Yemen High School Diploma Correlation Chart
The statistical analysis conducted on geographies consisting of 39,964,654 people shows a substantial negative correlation between the proportion of Yup'ik and percentage of population with at least high school diploma education in the United States with a correlation coefficient (R) of -0.554 and weighted average of 86.1%. Similarly, the statistical analysis conducted on geographies consisting of 82,429,885 people shows a weak negative correlation between the proportion of Immigrants from Yemen and percentage of population with at least high school diploma education in the United States with a correlation coefficient (R) of -0.293 and weighted average of 81.8%, a difference of 5.2%.
High School Diploma Correlation Summary
| Measurement | Yup'ik | Immigrants from Yemen |
| Minimum | 64.0% | 43.3% |
| Maximum | 100.0% | 96.4% |
| Range | 36.0% | 53.1% |
| Mean | 85.8% | 80.2% |
| Median | 86.9% | 82.6% |
| Interquartile 25% (IQ1) | 78.9% | 76.1% |
| Interquartile 75% (IQ3) | 93.4% | 86.2% |
| Interquartile Range (IQR) | 14.5% | 10.1% |
| Standard Deviation (Sample) | 9.1% | 10.1% |
| Standard Deviation (Population) | 9.0% | 10.0% |
Similar Demographics by High School Diploma
Demographics Similar to Yup'ik by High School Diploma
In terms of high school diploma, the demographic groups most similar to Yup'ik are Fijian (86.0%, a difference of 0.070%), Immigrants from Vietnam (86.2%, a difference of 0.11%), Ute (86.2%, a difference of 0.12%), Immigrants from St. Vincent and the Grenadines (86.2%, a difference of 0.15%), and Immigrants from West Indies (86.2%, a difference of 0.17%).
| Demographics | Rating | Rank | High School Diploma |
| Dutch West Indians | 0.0 /100 | #282 | Tragic 86.5% |
| Immigrants | Barbados | 0.0 /100 | #283 | Tragic 86.4% |
| Paiute | 0.0 /100 | #284 | Tragic 86.4% |
| Immigrants | West Indies | 0.0 /100 | #285 | Tragic 86.2% |
| Immigrants | St. Vincent and the Grenadines | 0.0 /100 | #286 | Tragic 86.2% |
| Ute | 0.0 /100 | #287 | Tragic 86.2% |
| Immigrants | Vietnam | 0.0 /100 | #288 | Tragic 86.2% |
| Yup'ik | 0.0 /100 | #289 | Tragic 86.1% |
| Fijians | 0.0 /100 | #290 | Tragic 86.0% |
| Haitians | 0.0 /100 | #291 | Tragic 85.9% |
| Japanese | 0.0 /100 | #292 | Tragic 85.9% |
| British West Indians | 0.0 /100 | #293 | Tragic 85.9% |
| Immigrants | Fiji | 0.0 /100 | #294 | Tragic 85.8% |
| Immigrants | Immigrants | 0.0 /100 | #295 | Tragic 85.8% |
| Immigrants | Cambodia | 0.0 /100 | #296 | Tragic 85.6% |
Demographics Similar to Immigrants from Yemen by High School Diploma
In terms of high school diploma, the demographic groups most similar to Immigrants from Yemen are Guatemalan (82.0%, a difference of 0.15%), Immigrants from Dominican Republic (82.0%, a difference of 0.15%), Salvadoran (81.7%, a difference of 0.17%), Tohono O'odham (82.1%, a difference of 0.27%), and Pima (81.6%, a difference of 0.27%).
| Demographics | Rating | Rank | High School Diploma |
| Immigrants | Azores | 0.0 /100 | #330 | Tragic 82.8% |
| Central Americans | 0.0 /100 | #331 | Tragic 82.5% |
| Immigrants | Honduras | 0.0 /100 | #332 | Tragic 82.5% |
| Immigrants | Latin America | 0.0 /100 | #333 | Tragic 82.1% |
| Tohono O'odham | 0.0 /100 | #334 | Tragic 82.1% |
| Guatemalans | 0.0 /100 | #335 | Tragic 82.0% |
| Immigrants | Dominican Republic | 0.0 /100 | #336 | Tragic 82.0% |
| Immigrants | Yemen | 0.0 /100 | #337 | Tragic 81.8% |
| Salvadorans | 0.0 /100 | #338 | Tragic 81.7% |
| Pima | 0.0 /100 | #339 | Tragic 81.6% |
| Houma | 0.0 /100 | #340 | Tragic 81.5% |
| Mexicans | 0.0 /100 | #341 | Tragic 81.4% |
| Immigrants | Guatemala | 0.0 /100 | #342 | Tragic 81.4% |
| Immigrants | El Salvador | 0.0 /100 | #343 | Tragic 80.8% |
| Immigrants | Central America | 0.0 /100 | #344 | Tragic 80.1% |