Yuman vs Comanche Nursery School
COMPARE
Yuman
Comanche
Nursery School
Nursery School Comparison
Yuman
Comanche
97.9%
NURSERY SCHOOL
25.7/ 100
METRIC RATING
197th/ 347
METRIC RANK
98.0%
NURSERY SCHOOL
66.0/ 100
METRIC RATING
157th/ 347
METRIC RANK
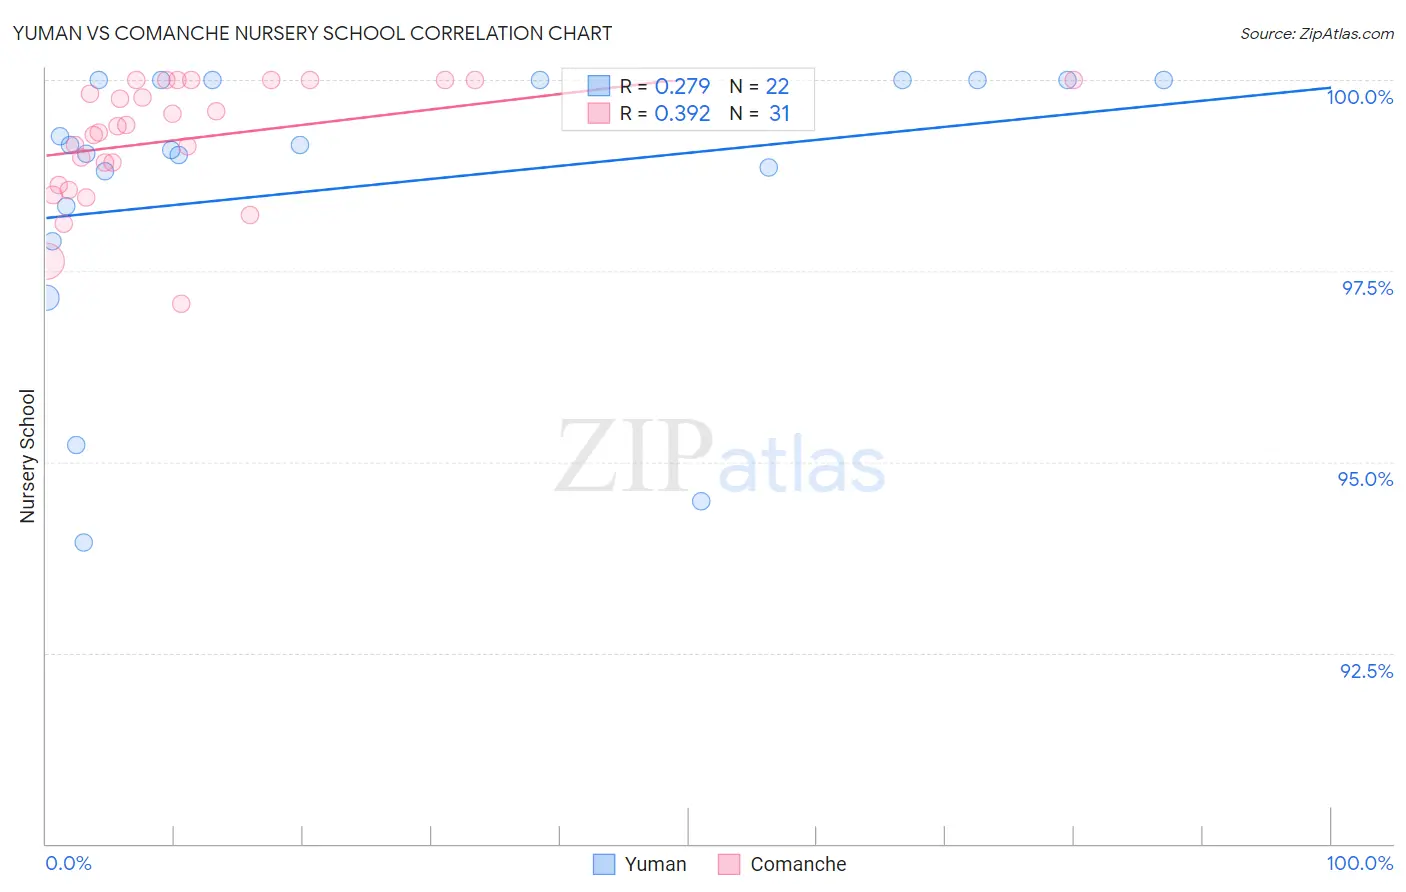
Yuman vs Comanche Nursery School Correlation Chart
The statistical analysis conducted on geographies consisting of 40,696,229 people shows a weak positive correlation between the proportion of Yuman and percentage of population with at least nursery school education in the United States with a correlation coefficient (R) of 0.279 and weighted average of 97.9%. Similarly, the statistical analysis conducted on geographies consisting of 109,786,530 people shows a mild positive correlation between the proportion of Comanche and percentage of population with at least nursery school education in the United States with a correlation coefficient (R) of 0.392 and weighted average of 98.0%, a difference of 0.13%.
Nursery School Correlation Summary
| Measurement | Yuman | Comanche |
| Minimum | 93.9% | 97.1% |
| Maximum | 100.0% | 100.0% |
| Range | 6.1% | 2.9% |
| Mean | 98.6% | 99.2% |
| Median | 99.1% | 99.4% |
| Interquartile 25% (IQ1) | 98.3% | 98.6% |
| Interquartile 75% (IQ3) | 100.0% | 100.0% |
| Interquartile Range (IQR) | 1.7% | 1.4% |
| Standard Deviation (Sample) | 1.8% | 0.78% |
| Standard Deviation (Population) | 1.8% | 0.77% |
Similar Demographics by Nursery School
Demographics Similar to Yuman by Nursery School
In terms of nursery school, the demographic groups most similar to Yuman are Guamanian/Chamorro (97.9%, a difference of 0.0%), Black/African American (97.9%, a difference of 0.010%), Paraguayan (97.9%, a difference of 0.010%), Mongolian (97.9%, a difference of 0.010%), and Hawaiian (97.9%, a difference of 0.010%).
| Demographics | Rating | Rank | Nursery School |
| Panamanians | 34.3 /100 | #190 | Fair 97.9% |
| Immigrants | Taiwan | 30.6 /100 | #191 | Fair 97.9% |
| Blacks/African Americans | 29.4 /100 | #192 | Fair 97.9% |
| Paraguayans | 27.4 /100 | #193 | Fair 97.9% |
| Mongolians | 27.3 /100 | #194 | Fair 97.9% |
| Hawaiians | 27.2 /100 | #195 | Fair 97.9% |
| Guamanians/Chamorros | 25.7 /100 | #196 | Fair 97.9% |
| Yuman | 25.7 /100 | #197 | Fair 97.9% |
| Immigrants | Kenya | 24.1 /100 | #198 | Fair 97.9% |
| Immigrants | Egypt | 22.5 /100 | #199 | Fair 97.9% |
| Tohono O'odham | 22.2 /100 | #200 | Fair 97.9% |
| Immigrants | Lebanon | 21.2 /100 | #201 | Fair 97.9% |
| Immigrants | Ukraine | 19.9 /100 | #202 | Poor 97.9% |
| Immigrants | Uganda | 18.0 /100 | #203 | Poor 97.9% |
| Immigrants | Southern Europe | 17.4 /100 | #204 | Poor 97.9% |
Demographics Similar to Comanche by Nursery School
In terms of nursery school, the demographic groups most similar to Comanche are Immigrants from South Central Asia (98.0%, a difference of 0.0%), Venezuelan (98.0%, a difference of 0.0%), Immigrants from North Macedonia (98.0%, a difference of 0.0%), Dutch West Indian (98.0%, a difference of 0.010%), and Immigrants from Moldova (98.0%, a difference of 0.010%).
| Demographics | Rating | Rank | Nursery School |
| Jordanians | 72.9 /100 | #150 | Good 98.1% |
| Soviet Union | 71.6 /100 | #151 | Good 98.0% |
| Dutch West Indians | 70.2 /100 | #152 | Good 98.0% |
| Immigrants | Moldova | 69.6 /100 | #153 | Good 98.0% |
| Immigrants | Iran | 68.7 /100 | #154 | Good 98.0% |
| Immigrants | South Central Asia | 66.7 /100 | #155 | Good 98.0% |
| Venezuelans | 66.6 /100 | #156 | Good 98.0% |
| Comanche | 66.0 /100 | #157 | Good 98.0% |
| Immigrants | North Macedonia | 65.7 /100 | #158 | Good 98.0% |
| French American Indians | 62.1 /100 | #159 | Good 98.0% |
| Immigrants | Russia | 59.9 /100 | #160 | Average 98.0% |
| Immigrants | Eastern Europe | 59.7 /100 | #161 | Average 98.0% |
| Brazilians | 59.4 /100 | #162 | Average 98.0% |
| Immigrants | Italy | 59.0 /100 | #163 | Average 98.0% |
| Ugandans | 56.4 /100 | #164 | Average 98.0% |