Immigrants from Eastern Africa vs West Indian Nursery School
COMPARE
Immigrants from Eastern Africa
West Indian
Nursery School
Nursery School Comparison
Immigrants from Eastern Africa
West Indians
97.6%
NURSERY SCHOOL
0.9/ 100
METRIC RATING
249th/ 347
METRIC RANK
97.5%
NURSERY SCHOOL
0.3/ 100
METRIC RATING
268th/ 347
METRIC RANK
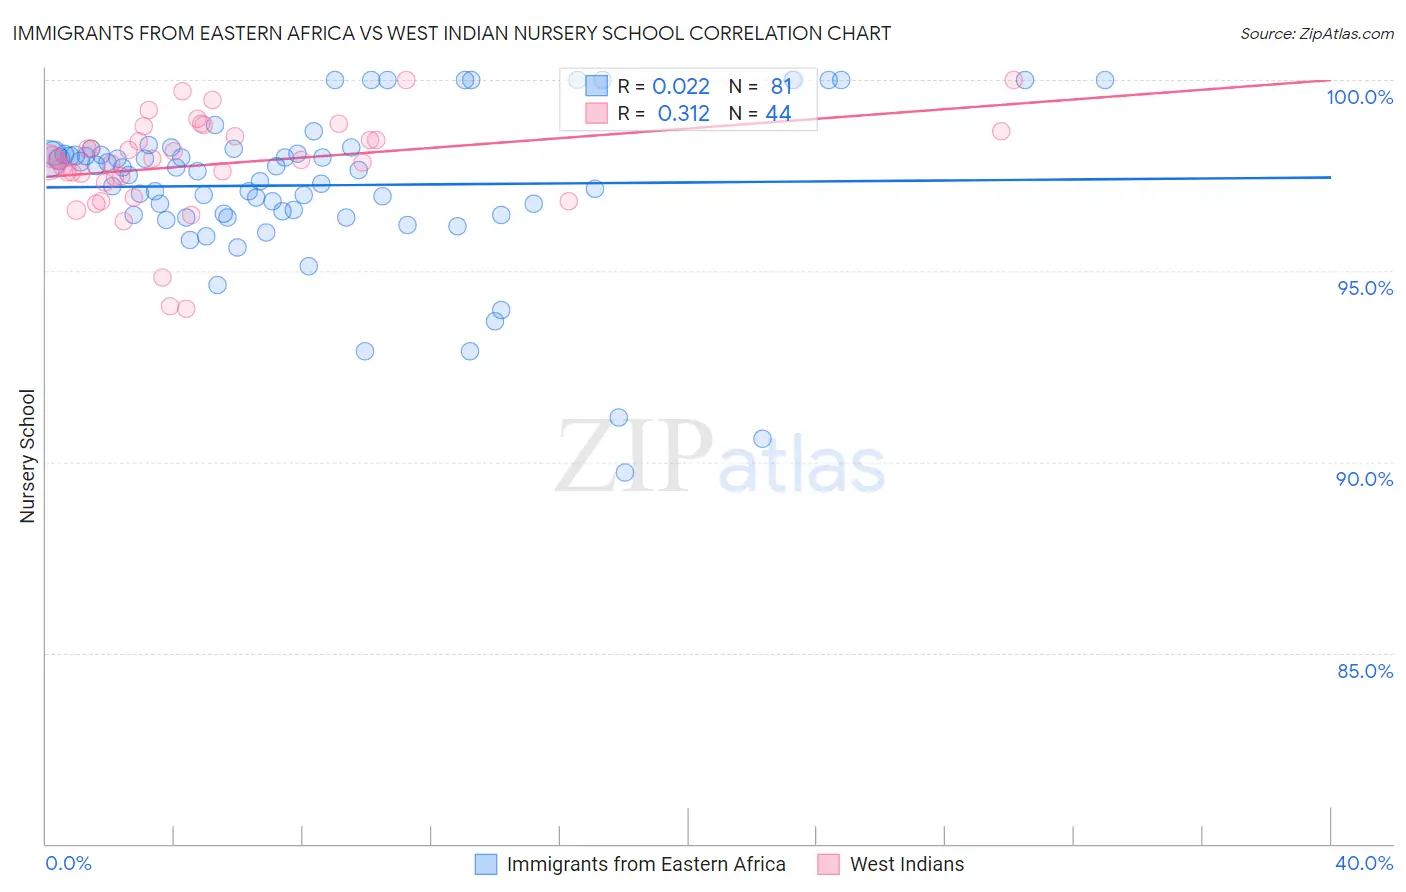
Immigrants from Eastern Africa vs West Indian Nursery School Correlation Chart
The statistical analysis conducted on geographies consisting of 355,144,184 people shows no correlation between the proportion of Immigrants from Eastern Africa and percentage of population with at least nursery school education in the United States with a correlation coefficient (R) of 0.022 and weighted average of 97.6%. Similarly, the statistical analysis conducted on geographies consisting of 254,063,654 people shows a mild positive correlation between the proportion of West Indians and percentage of population with at least nursery school education in the United States with a correlation coefficient (R) of 0.312 and weighted average of 97.5%, a difference of 0.090%.
Nursery School Correlation Summary
| Measurement | Immigrants from Eastern Africa | West Indian |
| Minimum | 89.7% | 94.0% |
| Maximum | 100.0% | 100.0% |
| Range | 10.3% | 6.0% |
| Mean | 97.2% | 97.8% |
| Median | 97.6% | 97.9% |
| Interquartile 25% (IQ1) | 96.5% | 97.4% |
| Interquartile 75% (IQ3) | 98.1% | 98.6% |
| Interquartile Range (IQR) | 1.7% | 1.2% |
| Standard Deviation (Sample) | 2.1% | 1.3% |
| Standard Deviation (Population) | 2.1% | 1.3% |
Demographics Similar to Immigrants from Eastern Africa and West Indians by Nursery School
In terms of nursery school, the demographic groups most similar to Immigrants from Eastern Africa are Indian (Asian) (97.6%, a difference of 0.0%), Immigrants from Senegal (97.6%, a difference of 0.0%), Ethiopian (97.6%, a difference of 0.010%), Immigrants from Africa (97.6%, a difference of 0.010%), and Immigrants from Iraq (97.6%, a difference of 0.020%). Similarly, the demographic groups most similar to West Indians are Immigrants from Nigeria (97.5%, a difference of 0.0%), Immigrants from Sierra Leone (97.6%, a difference of 0.010%), Fijian (97.6%, a difference of 0.020%), Taiwanese (97.6%, a difference of 0.020%), and Assyrian/Chaldean/Syriac (97.6%, a difference of 0.020%).
| Demographics | Rating | Rank | Nursery School |
| Indians (Asian) | 0.9 /100 | #248 | Tragic 97.6% |
| Immigrants | Eastern Africa | 0.9 /100 | #249 | Tragic 97.6% |
| Immigrants | Senegal | 0.9 /100 | #250 | Tragic 97.6% |
| Ethiopians | 0.8 /100 | #251 | Tragic 97.6% |
| Immigrants | Africa | 0.8 /100 | #252 | Tragic 97.6% |
| Immigrants | Iraq | 0.7 /100 | #253 | Tragic 97.6% |
| Immigrants | Congo | 0.7 /100 | #254 | Tragic 97.6% |
| Immigrants | Asia | 0.7 /100 | #255 | Tragic 97.6% |
| Yaqui | 0.6 /100 | #256 | Tragic 97.6% |
| Immigrants | Colombia | 0.6 /100 | #257 | Tragic 97.6% |
| Jamaicans | 0.6 /100 | #258 | Tragic 97.6% |
| Armenians | 0.4 /100 | #259 | Tragic 97.6% |
| Immigrants | South America | 0.4 /100 | #260 | Tragic 97.6% |
| Cubans | 0.4 /100 | #261 | Tragic 97.6% |
| Immigrants | Ethiopia | 0.4 /100 | #262 | Tragic 97.6% |
| Fijians | 0.3 /100 | #263 | Tragic 97.6% |
| Taiwanese | 0.3 /100 | #264 | Tragic 97.6% |
| Assyrians/Chaldeans/Syriacs | 0.3 /100 | #265 | Tragic 97.6% |
| Immigrants | Sierra Leone | 0.3 /100 | #266 | Tragic 97.6% |
| Immigrants | Nigeria | 0.3 /100 | #267 | Tragic 97.5% |
| West Indians | 0.3 /100 | #268 | Tragic 97.5% |