Tsimshian vs West Indian Nursery School
COMPARE
Tsimshian
West Indian
Nursery School
Nursery School Comparison
Tsimshian
West Indians
98.9%
NURSERY SCHOOL
100.0/ 100
METRIC RATING
5th/ 347
METRIC RANK
97.5%
NURSERY SCHOOL
0.3/ 100
METRIC RATING
268th/ 347
METRIC RANK
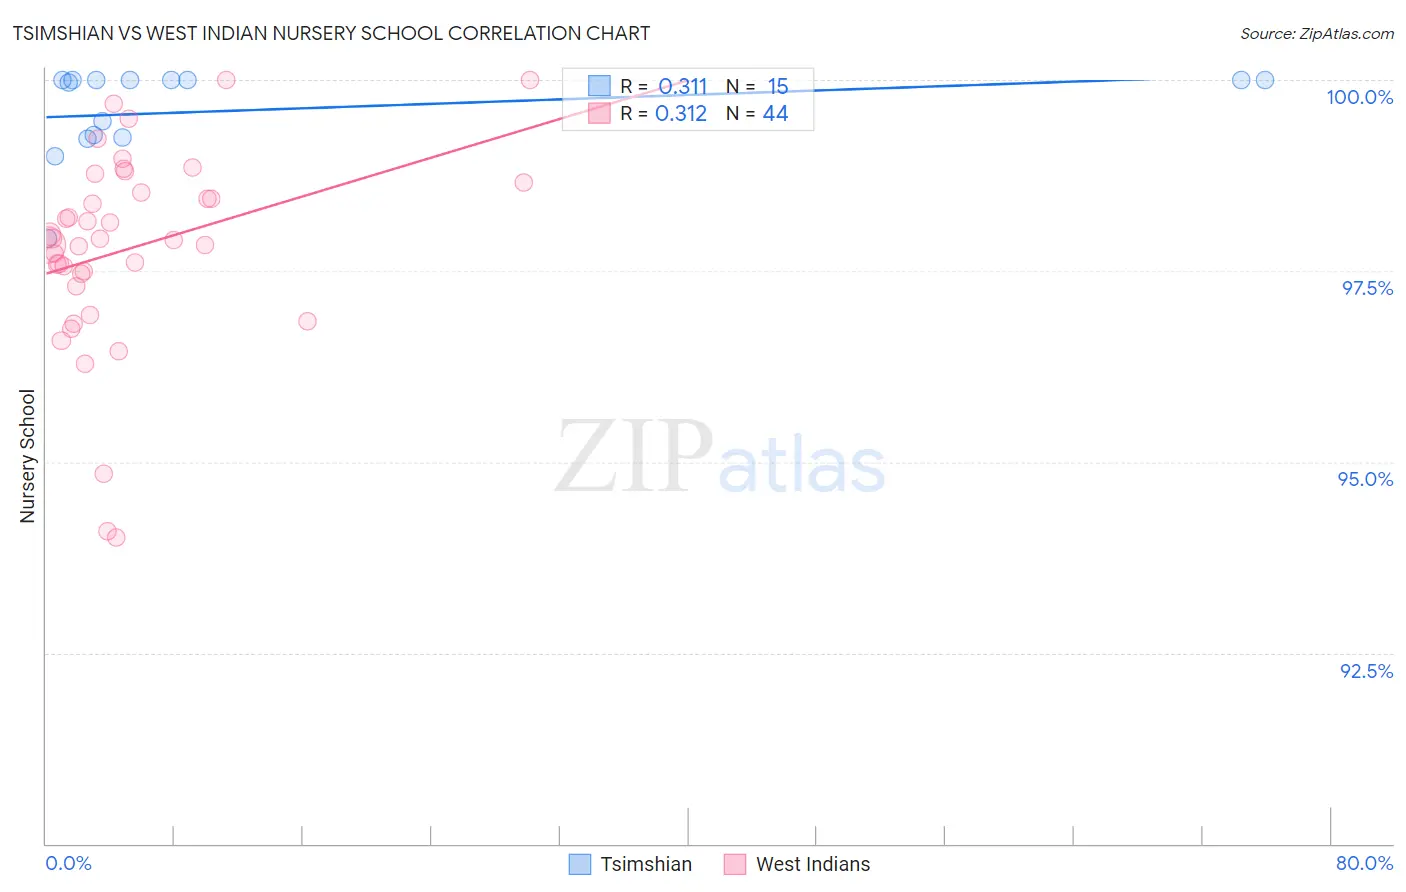
Tsimshian vs West Indian Nursery School Correlation Chart
The statistical analysis conducted on geographies consisting of 15,626,544 people shows a mild positive correlation between the proportion of Tsimshian and percentage of population with at least nursery school education in the United States with a correlation coefficient (R) of 0.311 and weighted average of 98.9%. Similarly, the statistical analysis conducted on geographies consisting of 254,063,654 people shows a mild positive correlation between the proportion of West Indians and percentage of population with at least nursery school education in the United States with a correlation coefficient (R) of 0.312 and weighted average of 97.5%, a difference of 1.3%.
Nursery School Correlation Summary
| Measurement | Tsimshian | West Indian |
| Minimum | 97.9% | 94.0% |
| Maximum | 100.0% | 100.0% |
| Range | 2.1% | 6.0% |
| Mean | 99.6% | 97.8% |
| Median | 100.0% | 97.9% |
| Interquartile 25% (IQ1) | 99.2% | 97.4% |
| Interquartile 75% (IQ3) | 100.0% | 98.6% |
| Interquartile Range (IQR) | 0.76% | 1.2% |
| Standard Deviation (Sample) | 0.60% | 1.3% |
| Standard Deviation (Population) | 0.58% | 1.3% |
Similar Demographics by Nursery School
Demographics Similar to Tsimshian by Nursery School
In terms of nursery school, the demographic groups most similar to Tsimshian are Welsh (98.9%, a difference of 0.030%), Inupiat (98.9%, a difference of 0.030%), Alaskan Athabascan (98.8%, a difference of 0.070%), Alaska Native (98.8%, a difference of 0.10%), and Norwegian (98.7%, a difference of 0.12%).
| Demographics | Rating | Rank | Nursery School |
| Crow | 100.0 /100 | #1 | Exceptional 99.7% |
| Yup'ik | 100.0 /100 | #2 | Exceptional 99.2% |
| Welsh | 100.0 /100 | #3 | Exceptional 98.9% |
| Inupiat | 100.0 /100 | #4 | Exceptional 98.9% |
| Tsimshian | 100.0 /100 | #5 | Exceptional 98.9% |
| Alaskan Athabascans | 100.0 /100 | #6 | Exceptional 98.8% |
| Alaska Natives | 100.0 /100 | #7 | Exceptional 98.8% |
| Norwegians | 100.0 /100 | #8 | Exceptional 98.7% |
| Slovaks | 100.0 /100 | #9 | Exceptional 98.7% |
| Germans | 100.0 /100 | #10 | Exceptional 98.7% |
| Tlingit-Haida | 100.0 /100 | #11 | Exceptional 98.7% |
| Slovenes | 100.0 /100 | #12 | Exceptional 98.7% |
| English | 100.0 /100 | #13 | Exceptional 98.7% |
| Carpatho Rusyns | 100.0 /100 | #14 | Exceptional 98.7% |
| Swedes | 100.0 /100 | #15 | Exceptional 98.7% |
Demographics Similar to West Indians by Nursery School
In terms of nursery school, the demographic groups most similar to West Indians are Immigrants from Nigeria (97.5%, a difference of 0.0%), Immigrants from Liberia (97.5%, a difference of 0.0%), Immigrants from Sierra Leone (97.6%, a difference of 0.010%), Immigrants from Jamaica (97.5%, a difference of 0.010%), and Fijian (97.6%, a difference of 0.020%).
| Demographics | Rating | Rank | Nursery School |
| Cubans | 0.4 /100 | #261 | Tragic 97.6% |
| Immigrants | Ethiopia | 0.4 /100 | #262 | Tragic 97.6% |
| Fijians | 0.3 /100 | #263 | Tragic 97.6% |
| Taiwanese | 0.3 /100 | #264 | Tragic 97.6% |
| Assyrians/Chaldeans/Syriacs | 0.3 /100 | #265 | Tragic 97.6% |
| Immigrants | Sierra Leone | 0.3 /100 | #266 | Tragic 97.6% |
| Immigrants | Nigeria | 0.3 /100 | #267 | Tragic 97.5% |
| West Indians | 0.3 /100 | #268 | Tragic 97.5% |
| Immigrants | Liberia | 0.3 /100 | #269 | Tragic 97.5% |
| Immigrants | Jamaica | 0.2 /100 | #270 | Tragic 97.5% |
| Immigrants | Peru | 0.2 /100 | #271 | Tragic 97.5% |
| Immigrants | Bolivia | 0.1 /100 | #272 | Tragic 97.5% |
| Immigrants | China | 0.1 /100 | #273 | Tragic 97.5% |
| Immigrants | Cameroon | 0.1 /100 | #274 | Tragic 97.5% |
| Ghanaians | 0.1 /100 | #275 | Tragic 97.5% |