Yuman vs Spaniard College, 1 year or more
COMPARE
Yuman
Spaniard
College, 1 year or more
College, 1 year or more Comparison
Yuman
Spaniards
48.7%
COLLEGE, 1 YEAR OR MORE
0.0/ 100
METRIC RATING
335th/ 347
METRIC RANK
59.0%
COLLEGE, 1 YEAR OR MORE
38.3/ 100
METRIC RATING
184th/ 347
METRIC RANK
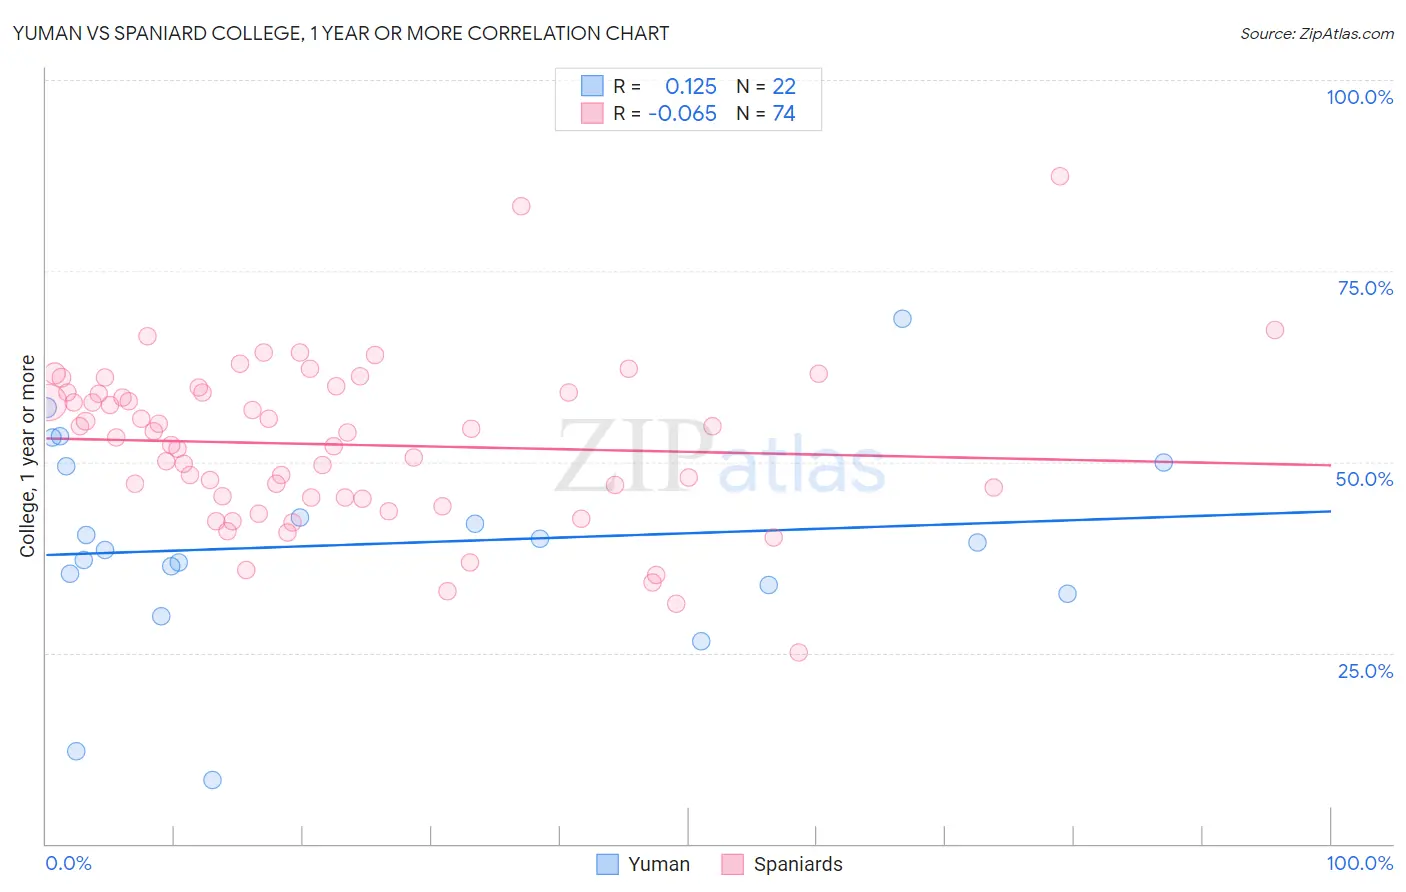
Yuman vs Spaniard College, 1 year or more Correlation Chart
The statistical analysis conducted on geographies consisting of 40,696,202 people shows a poor positive correlation between the proportion of Yuman and percentage of population with at least college, 1 year or more education in the United States with a correlation coefficient (R) of 0.125 and weighted average of 48.7%. Similarly, the statistical analysis conducted on geographies consisting of 443,541,237 people shows a slight negative correlation between the proportion of Spaniards and percentage of population with at least college, 1 year or more education in the United States with a correlation coefficient (R) of -0.065 and weighted average of 59.0%, a difference of 21.2%.
College, 1 year or more Correlation Summary
| Measurement | Yuman | Spaniard |
| Minimum | 8.3% | 25.0% |
| Maximum | 68.8% | 87.4% |
| Range | 60.4% | 62.4% |
| Mean | 39.3% | 52.3% |
| Median | 39.0% | 53.6% |
| Interquartile 25% (IQ1) | 34.0% | 45.3% |
| Interquartile 75% (IQ3) | 49.5% | 59.1% |
| Interquartile Range (IQR) | 15.5% | 13.8% |
| Standard Deviation (Sample) | 13.6% | 10.8% |
| Standard Deviation (Population) | 13.3% | 10.7% |
Similar Demographics by College, 1 year or more
Demographics Similar to Yuman by College, 1 year or more
In terms of college, 1 year or more, the demographic groups most similar to Yuman are Lumbee (48.9%, a difference of 0.28%), Spanish American Indian (48.5%, a difference of 0.44%), Pennsylvania German (48.5%, a difference of 0.45%), Immigrants from Central America (48.5%, a difference of 0.50%), and Immigrants from the Azores (48.4%, a difference of 0.76%).
| Demographics | Rating | Rank | College, 1 year or more |
| Dutch West Indians | 0.0 /100 | #328 | Tragic 50.5% |
| Cape Verdeans | 0.0 /100 | #329 | Tragic 50.3% |
| Natives/Alaskans | 0.0 /100 | #330 | Tragic 50.2% |
| Immigrants | Yemen | 0.0 /100 | #331 | Tragic 50.0% |
| Mexicans | 0.0 /100 | #332 | Tragic 49.2% |
| Immigrants | Dominican Republic | 0.0 /100 | #333 | Tragic 49.1% |
| Lumbee | 0.0 /100 | #334 | Tragic 48.9% |
| Yuman | 0.0 /100 | #335 | Tragic 48.7% |
| Spanish American Indians | 0.0 /100 | #336 | Tragic 48.5% |
| Pennsylvania Germans | 0.0 /100 | #337 | Tragic 48.5% |
| Immigrants | Central America | 0.0 /100 | #338 | Tragic 48.5% |
| Immigrants | Azores | 0.0 /100 | #339 | Tragic 48.4% |
| Immigrants | Cabo Verde | 0.0 /100 | #340 | Tragic 48.1% |
| Immigrants | Mexico | 0.0 /100 | #341 | Tragic 47.5% |
| Inupiat | 0.0 /100 | #342 | Tragic 47.2% |
Demographics Similar to Spaniards by College, 1 year or more
In terms of college, 1 year or more, the demographic groups most similar to Spaniards are German Russian (59.1%, a difference of 0.060%), South American (59.0%, a difference of 0.14%), Scotch-Irish (58.9%, a difference of 0.21%), German (58.9%, a difference of 0.21%), and French (58.9%, a difference of 0.23%).
| Demographics | Rating | Rank | College, 1 year or more |
| Tlingit-Haida | 48.4 /100 | #177 | Average 59.4% |
| Czechoslovakians | 48.3 /100 | #178 | Average 59.4% |
| Bermudans | 46.6 /100 | #179 | Average 59.3% |
| Yugoslavians | 44.1 /100 | #180 | Average 59.2% |
| Swiss | 43.4 /100 | #181 | Average 59.2% |
| Immigrants | Bosnia and Herzegovina | 42.8 /100 | #182 | Average 59.2% |
| German Russians | 39.3 /100 | #183 | Fair 59.1% |
| Spaniards | 38.3 /100 | #184 | Fair 59.0% |
| South Americans | 35.9 /100 | #185 | Fair 59.0% |
| Scotch-Irish | 34.7 /100 | #186 | Fair 58.9% |
| Germans | 34.7 /100 | #187 | Fair 58.9% |
| French | 34.4 /100 | #188 | Fair 58.9% |
| Uruguayans | 31.8 /100 | #189 | Fair 58.8% |
| Immigrants | Cameroon | 31.2 /100 | #190 | Fair 58.8% |
| Immigrants | Philippines | 29.2 /100 | #191 | Fair 58.7% |