Immigrants from Zaire vs Spaniard College, 1 year or more
COMPARE
Immigrants from Zaire
Spaniard
College, 1 year or more
College, 1 year or more Comparison
Immigrants from Zaire
Spaniards
58.3%
COLLEGE, 1 YEAR OR MORE
18.7/ 100
METRIC RATING
205th/ 347
METRIC RANK
59.0%
COLLEGE, 1 YEAR OR MORE
38.3/ 100
METRIC RATING
184th/ 347
METRIC RANK
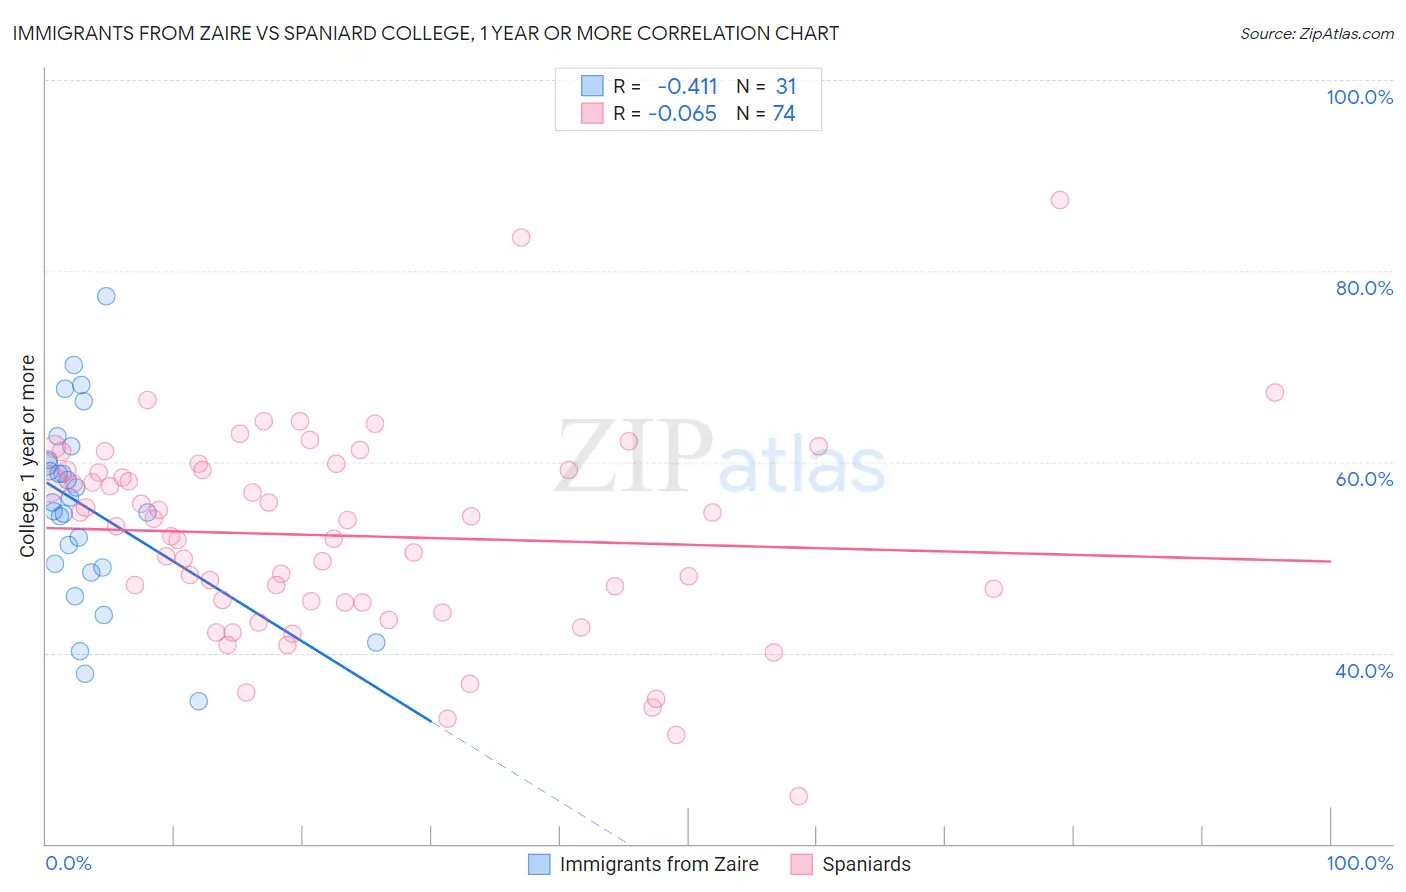
Immigrants from Zaire vs Spaniard College, 1 year or more Correlation Chart
The statistical analysis conducted on geographies consisting of 107,255,700 people shows a moderate negative correlation between the proportion of Immigrants from Zaire and percentage of population with at least college, 1 year or more education in the United States with a correlation coefficient (R) of -0.411 and weighted average of 58.3%. Similarly, the statistical analysis conducted on geographies consisting of 443,541,237 people shows a slight negative correlation between the proportion of Spaniards and percentage of population with at least college, 1 year or more education in the United States with a correlation coefficient (R) of -0.065 and weighted average of 59.0%, a difference of 1.3%.
College, 1 year or more Correlation Summary
| Measurement | Immigrants from Zaire | Spaniard |
| Minimum | 35.0% | 25.0% |
| Maximum | 77.4% | 87.4% |
| Range | 42.4% | 62.4% |
| Mean | 55.2% | 52.3% |
| Median | 55.8% | 53.6% |
| Interquartile 25% (IQ1) | 48.9% | 45.3% |
| Interquartile 75% (IQ3) | 60.2% | 59.1% |
| Interquartile Range (IQR) | 11.3% | 13.8% |
| Standard Deviation (Sample) | 9.8% | 10.8% |
| Standard Deviation (Population) | 9.6% | 10.7% |
Similar Demographics by College, 1 year or more
Demographics Similar to Immigrants from Zaire by College, 1 year or more
In terms of college, 1 year or more, the demographic groups most similar to Immigrants from Zaire are Immigrants from Vietnam (58.2%, a difference of 0.040%), Panamanian (58.3%, a difference of 0.050%), Senegalese (58.2%, a difference of 0.16%), Ghanaian (58.4%, a difference of 0.19%), and Immigrants from South America (58.4%, a difference of 0.27%).
| Demographics | Rating | Rank | College, 1 year or more |
| Immigrants | South Eastern Asia | 25.1 /100 | #198 | Fair 58.5% |
| Slovaks | 24.6 /100 | #199 | Fair 58.5% |
| Spanish | 24.2 /100 | #200 | Fair 58.5% |
| Nigerians | 23.0 /100 | #201 | Fair 58.5% |
| Immigrants | South America | 21.9 /100 | #202 | Fair 58.4% |
| Ghanaians | 20.9 /100 | #203 | Fair 58.4% |
| Panamanians | 19.2 /100 | #204 | Poor 58.3% |
| Immigrants | Zaire | 18.7 /100 | #205 | Poor 58.3% |
| Immigrants | Vietnam | 18.2 /100 | #206 | Poor 58.2% |
| Senegalese | 16.9 /100 | #207 | Poor 58.2% |
| Immigrants | Uruguay | 15.2 /100 | #208 | Poor 58.1% |
| Immigrants | Middle Africa | 14.0 /100 | #209 | Poor 58.0% |
| Tsimshian | 13.5 /100 | #210 | Poor 57.9% |
| Immigrants | Nigeria | 13.3 /100 | #211 | Poor 57.9% |
| Immigrants | Senegal | 11.8 /100 | #212 | Poor 57.8% |
Demographics Similar to Spaniards by College, 1 year or more
In terms of college, 1 year or more, the demographic groups most similar to Spaniards are German Russian (59.1%, a difference of 0.060%), South American (59.0%, a difference of 0.14%), Scotch-Irish (58.9%, a difference of 0.21%), German (58.9%, a difference of 0.21%), and French (58.9%, a difference of 0.23%).
| Demographics | Rating | Rank | College, 1 year or more |
| Tlingit-Haida | 48.4 /100 | #177 | Average 59.4% |
| Czechoslovakians | 48.3 /100 | #178 | Average 59.4% |
| Bermudans | 46.6 /100 | #179 | Average 59.3% |
| Yugoslavians | 44.1 /100 | #180 | Average 59.2% |
| Swiss | 43.4 /100 | #181 | Average 59.2% |
| Immigrants | Bosnia and Herzegovina | 42.8 /100 | #182 | Average 59.2% |
| German Russians | 39.3 /100 | #183 | Fair 59.1% |
| Spaniards | 38.3 /100 | #184 | Fair 59.0% |
| South Americans | 35.9 /100 | #185 | Fair 59.0% |
| Scotch-Irish | 34.7 /100 | #186 | Fair 58.9% |
| Germans | 34.7 /100 | #187 | Fair 58.9% |
| French | 34.4 /100 | #188 | Fair 58.9% |
| Uruguayans | 31.8 /100 | #189 | Fair 58.8% |
| Immigrants | Cameroon | 31.2 /100 | #190 | Fair 58.8% |
| Immigrants | Philippines | 29.2 /100 | #191 | Fair 58.7% |