Apache vs Spaniard College, 1 year or more
COMPARE
Apache
Spaniard
College, 1 year or more
College, 1 year or more Comparison
Apache
Spaniards
51.8%
COLLEGE, 1 YEAR OR MORE
0.0/ 100
METRIC RATING
309th/ 347
METRIC RANK
59.0%
COLLEGE, 1 YEAR OR MORE
38.3/ 100
METRIC RATING
184th/ 347
METRIC RANK
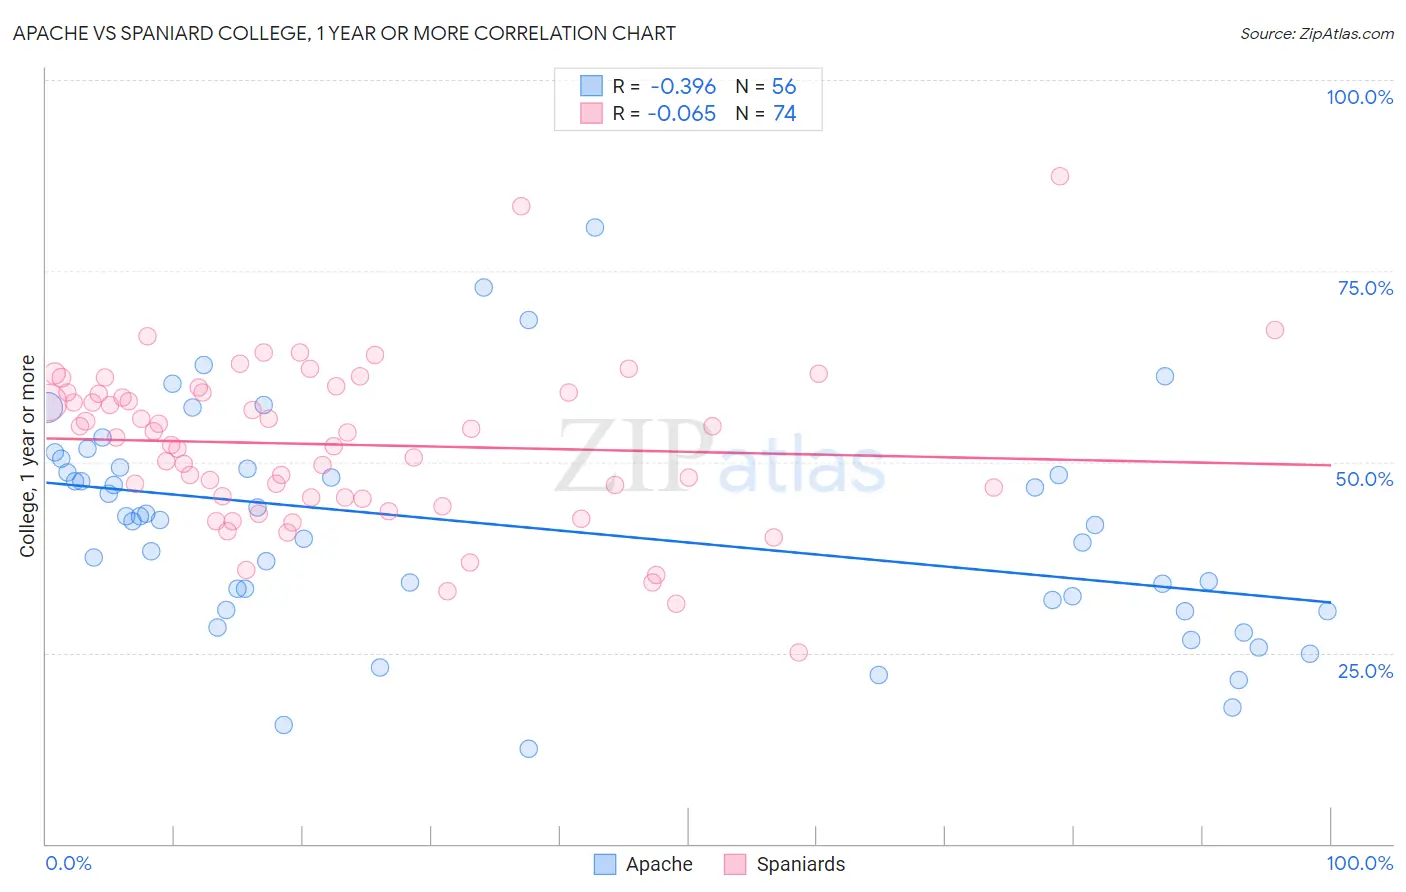
Apache vs Spaniard College, 1 year or more Correlation Chart
The statistical analysis conducted on geographies consisting of 231,142,948 people shows a mild negative correlation between the proportion of Apache and percentage of population with at least college, 1 year or more education in the United States with a correlation coefficient (R) of -0.396 and weighted average of 51.8%. Similarly, the statistical analysis conducted on geographies consisting of 443,541,237 people shows a slight negative correlation between the proportion of Spaniards and percentage of population with at least college, 1 year or more education in the United States with a correlation coefficient (R) of -0.065 and weighted average of 59.0%, a difference of 14.0%.
College, 1 year or more Correlation Summary
| Measurement | Apache | Spaniard |
| Minimum | 12.5% | 25.0% |
| Maximum | 80.6% | 87.4% |
| Range | 68.1% | 62.4% |
| Mean | 41.5% | 52.3% |
| Median | 42.4% | 53.6% |
| Interquartile 25% (IQ1) | 31.2% | 45.3% |
| Interquartile 75% (IQ3) | 49.2% | 59.1% |
| Interquartile Range (IQR) | 18.0% | 13.8% |
| Standard Deviation (Sample) | 14.3% | 10.8% |
| Standard Deviation (Population) | 14.1% | 10.7% |
Similar Demographics by College, 1 year or more
Demographics Similar to Apache by College, 1 year or more
In terms of college, 1 year or more, the demographic groups most similar to Apache are Salvadoran (51.8%, a difference of 0.010%), Immigrants from Portugal (51.9%, a difference of 0.11%), Mexican American Indian (51.9%, a difference of 0.22%), Honduran (51.6%, a difference of 0.39%), and Seminole (52.1%, a difference of 0.55%).
| Demographics | Rating | Rank | College, 1 year or more |
| Puerto Ricans | 0.0 /100 | #302 | Tragic 52.2% |
| Creek | 0.0 /100 | #303 | Tragic 52.2% |
| Central Americans | 0.0 /100 | #304 | Tragic 52.1% |
| Seminole | 0.0 /100 | #305 | Tragic 52.1% |
| Mexican American Indians | 0.0 /100 | #306 | Tragic 51.9% |
| Immigrants | Portugal | 0.0 /100 | #307 | Tragic 51.9% |
| Salvadorans | 0.0 /100 | #308 | Tragic 51.8% |
| Apache | 0.0 /100 | #309 | Tragic 51.8% |
| Hondurans | 0.0 /100 | #310 | Tragic 51.6% |
| Immigrants | Haiti | 0.0 /100 | #311 | Tragic 51.5% |
| Pueblo | 0.0 /100 | #312 | Tragic 51.5% |
| Immigrants | Caribbean | 0.0 /100 | #313 | Tragic 51.4% |
| Fijians | 0.0 /100 | #314 | Tragic 51.3% |
| Guatemalans | 0.0 /100 | #315 | Tragic 51.2% |
| Cajuns | 0.0 /100 | #316 | Tragic 51.2% |
Demographics Similar to Spaniards by College, 1 year or more
In terms of college, 1 year or more, the demographic groups most similar to Spaniards are German Russian (59.1%, a difference of 0.060%), South American (59.0%, a difference of 0.14%), Scotch-Irish (58.9%, a difference of 0.21%), German (58.9%, a difference of 0.21%), and French (58.9%, a difference of 0.23%).
| Demographics | Rating | Rank | College, 1 year or more |
| Tlingit-Haida | 48.4 /100 | #177 | Average 59.4% |
| Czechoslovakians | 48.3 /100 | #178 | Average 59.4% |
| Bermudans | 46.6 /100 | #179 | Average 59.3% |
| Yugoslavians | 44.1 /100 | #180 | Average 59.2% |
| Swiss | 43.4 /100 | #181 | Average 59.2% |
| Immigrants | Bosnia and Herzegovina | 42.8 /100 | #182 | Average 59.2% |
| German Russians | 39.3 /100 | #183 | Fair 59.1% |
| Spaniards | 38.3 /100 | #184 | Fair 59.0% |
| South Americans | 35.9 /100 | #185 | Fair 59.0% |
| Scotch-Irish | 34.7 /100 | #186 | Fair 58.9% |
| Germans | 34.7 /100 | #187 | Fair 58.9% |
| French | 34.4 /100 | #188 | Fair 58.9% |
| Uruguayans | 31.8 /100 | #189 | Fair 58.8% |
| Immigrants | Cameroon | 31.2 /100 | #190 | Fair 58.8% |
| Immigrants | Philippines | 29.2 /100 | #191 | Fair 58.7% |