Choctaw vs Spaniard College, 1 year or more
COMPARE
Choctaw
Spaniard
College, 1 year or more
College, 1 year or more Comparison
Choctaw
Spaniards
52.3%
COLLEGE, 1 YEAR OR MORE
0.0/ 100
METRIC RATING
300th/ 347
METRIC RANK
59.0%
COLLEGE, 1 YEAR OR MORE
38.3/ 100
METRIC RATING
184th/ 347
METRIC RANK
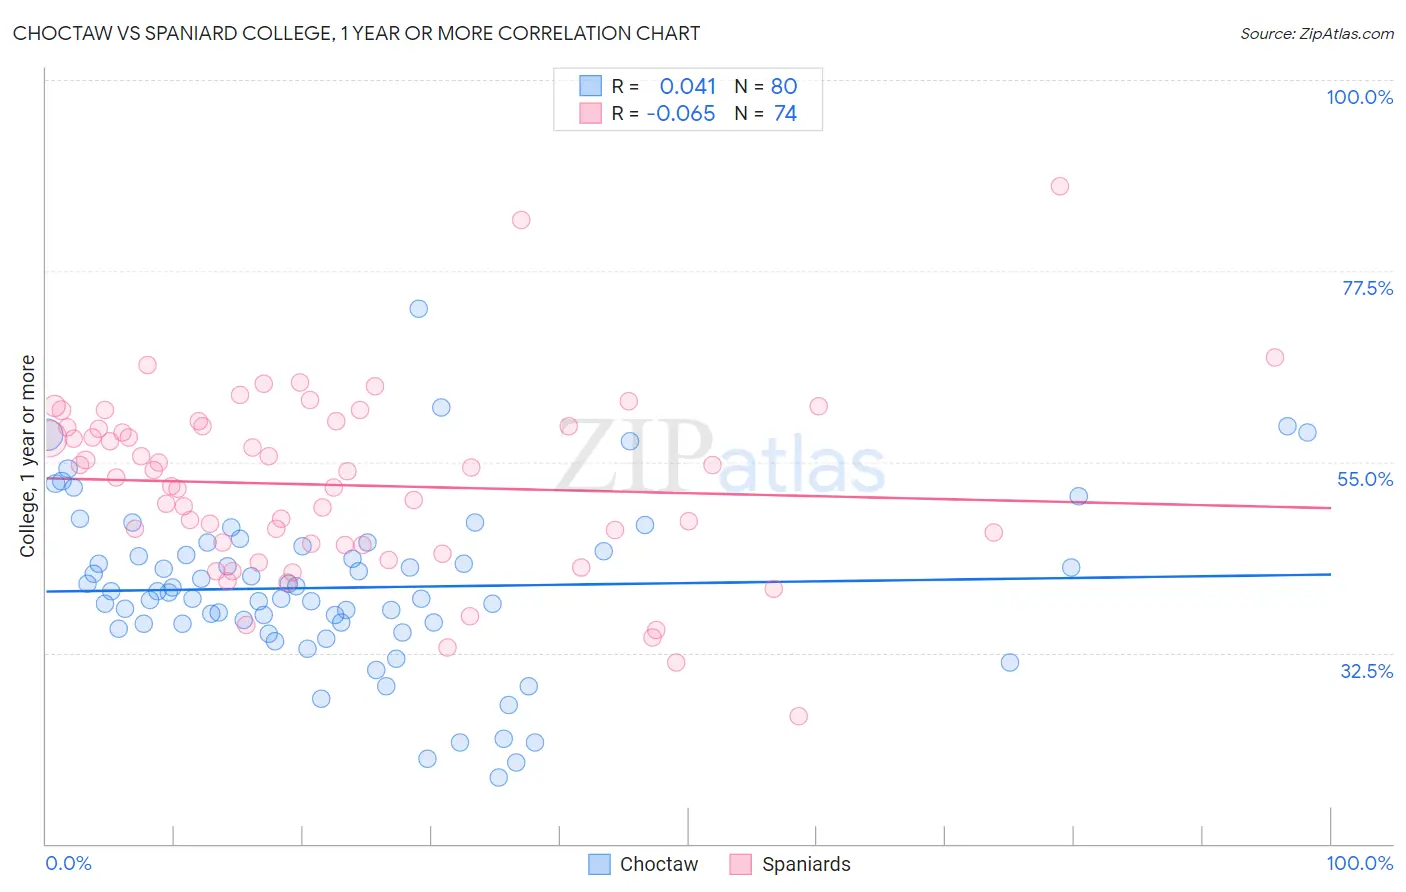
Choctaw vs Spaniard College, 1 year or more Correlation Chart
The statistical analysis conducted on geographies consisting of 269,741,564 people shows no correlation between the proportion of Choctaw and percentage of population with at least college, 1 year or more education in the United States with a correlation coefficient (R) of 0.041 and weighted average of 52.3%. Similarly, the statistical analysis conducted on geographies consisting of 443,541,237 people shows a slight negative correlation between the proportion of Spaniards and percentage of population with at least college, 1 year or more education in the United States with a correlation coefficient (R) of -0.065 and weighted average of 59.0%, a difference of 12.8%.
College, 1 year or more Correlation Summary
| Measurement | Choctaw | Spaniard |
| Minimum | 17.8% | 25.0% |
| Maximum | 73.1% | 87.4% |
| Range | 55.3% | 62.4% |
| Mean | 40.2% | 52.3% |
| Median | 39.7% | 53.6% |
| Interquartile 25% (IQ1) | 35.9% | 45.3% |
| Interquartile 75% (IQ3) | 44.7% | 59.1% |
| Interquartile Range (IQR) | 8.8% | 13.8% |
| Standard Deviation (Sample) | 9.9% | 10.8% |
| Standard Deviation (Population) | 9.8% | 10.7% |
Similar Demographics by College, 1 year or more
Demographics Similar to Choctaw by College, 1 year or more
In terms of college, 1 year or more, the demographic groups most similar to Choctaw are Immigrants from Nicaragua (52.4%, a difference of 0.040%), Haitian (52.3%, a difference of 0.060%), Puerto Rican (52.2%, a difference of 0.19%), Creek (52.2%, a difference of 0.26%), and Immigrants from Dominica (52.5%, a difference of 0.38%).
| Demographics | Rating | Rank | College, 1 year or more |
| Blacks/African Americans | 0.0 /100 | #293 | Tragic 53.3% |
| Cherokee | 0.0 /100 | #294 | Tragic 53.2% |
| Yaqui | 0.0 /100 | #295 | Tragic 53.2% |
| Sioux | 0.0 /100 | #296 | Tragic 53.0% |
| Paiute | 0.0 /100 | #297 | Tragic 52.9% |
| Immigrants | Dominica | 0.0 /100 | #298 | Tragic 52.5% |
| Immigrants | Nicaragua | 0.0 /100 | #299 | Tragic 52.4% |
| Choctaw | 0.0 /100 | #300 | Tragic 52.3% |
| Haitians | 0.0 /100 | #301 | Tragic 52.3% |
| Puerto Ricans | 0.0 /100 | #302 | Tragic 52.2% |
| Creek | 0.0 /100 | #303 | Tragic 52.2% |
| Central Americans | 0.0 /100 | #304 | Tragic 52.1% |
| Seminole | 0.0 /100 | #305 | Tragic 52.1% |
| Mexican American Indians | 0.0 /100 | #306 | Tragic 51.9% |
| Immigrants | Portugal | 0.0 /100 | #307 | Tragic 51.9% |
Demographics Similar to Spaniards by College, 1 year or more
In terms of college, 1 year or more, the demographic groups most similar to Spaniards are German Russian (59.1%, a difference of 0.060%), South American (59.0%, a difference of 0.14%), Scotch-Irish (58.9%, a difference of 0.21%), German (58.9%, a difference of 0.21%), and French (58.9%, a difference of 0.23%).
| Demographics | Rating | Rank | College, 1 year or more |
| Tlingit-Haida | 48.4 /100 | #177 | Average 59.4% |
| Czechoslovakians | 48.3 /100 | #178 | Average 59.4% |
| Bermudans | 46.6 /100 | #179 | Average 59.3% |
| Yugoslavians | 44.1 /100 | #180 | Average 59.2% |
| Swiss | 43.4 /100 | #181 | Average 59.2% |
| Immigrants | Bosnia and Herzegovina | 42.8 /100 | #182 | Average 59.2% |
| German Russians | 39.3 /100 | #183 | Fair 59.1% |
| Spaniards | 38.3 /100 | #184 | Fair 59.0% |
| South Americans | 35.9 /100 | #185 | Fair 59.0% |
| Scotch-Irish | 34.7 /100 | #186 | Fair 58.9% |
| Germans | 34.7 /100 | #187 | Fair 58.9% |
| French | 34.4 /100 | #188 | Fair 58.9% |
| Uruguayans | 31.8 /100 | #189 | Fair 58.8% |
| Immigrants | Cameroon | 31.2 /100 | #190 | Fair 58.8% |
| Immigrants | Philippines | 29.2 /100 | #191 | Fair 58.7% |