Yuman vs Immigrants from Belize College, 1 year or more
COMPARE
Yuman
Immigrants from Belize
College, 1 year or more
College, 1 year or more Comparison
Yuman
Immigrants from Belize
48.7%
COLLEGE, 1 YEAR OR MORE
0.0/ 100
METRIC RATING
335th/ 347
METRIC RANK
53.5%
COLLEGE, 1 YEAR OR MORE
0.1/ 100
METRIC RATING
287th/ 347
METRIC RANK
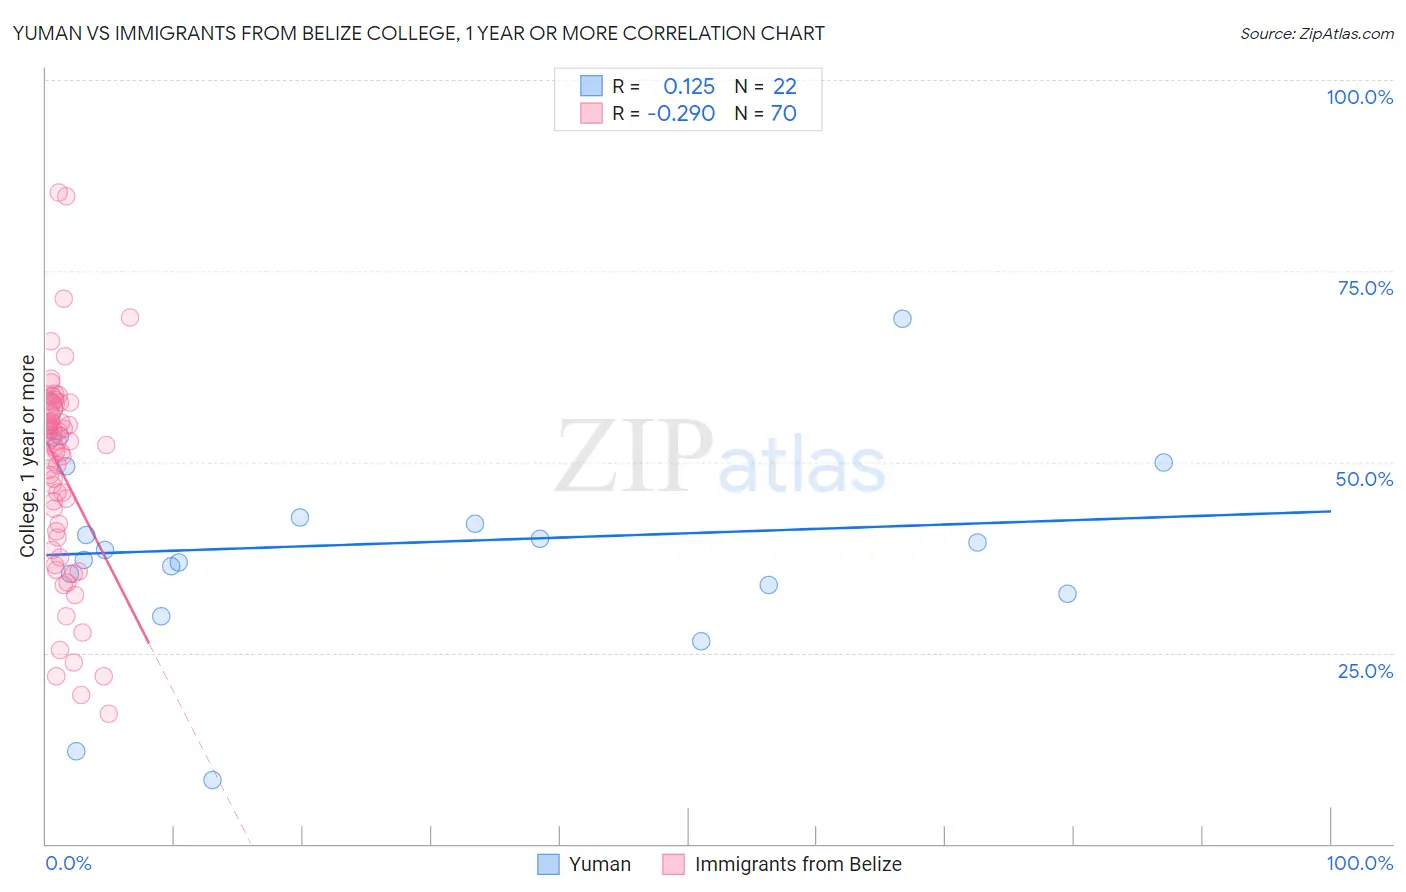
Yuman vs Immigrants from Belize College, 1 year or more Correlation Chart
The statistical analysis conducted on geographies consisting of 40,696,202 people shows a poor positive correlation between the proportion of Yuman and percentage of population with at least college, 1 year or more education in the United States with a correlation coefficient (R) of 0.125 and weighted average of 48.7%. Similarly, the statistical analysis conducted on geographies consisting of 130,329,081 people shows a weak negative correlation between the proportion of Immigrants from Belize and percentage of population with at least college, 1 year or more education in the United States with a correlation coefficient (R) of -0.290 and weighted average of 53.5%, a difference of 9.8%.
College, 1 year or more Correlation Summary
| Measurement | Yuman | Immigrants from Belize |
| Minimum | 8.3% | 17.1% |
| Maximum | 68.8% | 85.3% |
| Range | 60.4% | 68.2% |
| Mean | 39.3% | 48.8% |
| Median | 39.0% | 52.1% |
| Interquartile 25% (IQ1) | 34.0% | 40.1% |
| Interquartile 75% (IQ3) | 49.5% | 57.4% |
| Interquartile Range (IQR) | 15.5% | 17.2% |
| Standard Deviation (Sample) | 13.6% | 13.7% |
| Standard Deviation (Population) | 13.3% | 13.6% |
Similar Demographics by College, 1 year or more
Demographics Similar to Yuman by College, 1 year or more
In terms of college, 1 year or more, the demographic groups most similar to Yuman are Lumbee (48.9%, a difference of 0.28%), Spanish American Indian (48.5%, a difference of 0.44%), Pennsylvania German (48.5%, a difference of 0.45%), Immigrants from Central America (48.5%, a difference of 0.50%), and Immigrants from the Azores (48.4%, a difference of 0.76%).
| Demographics | Rating | Rank | College, 1 year or more |
| Dutch West Indians | 0.0 /100 | #328 | Tragic 50.5% |
| Cape Verdeans | 0.0 /100 | #329 | Tragic 50.3% |
| Natives/Alaskans | 0.0 /100 | #330 | Tragic 50.2% |
| Immigrants | Yemen | 0.0 /100 | #331 | Tragic 50.0% |
| Mexicans | 0.0 /100 | #332 | Tragic 49.2% |
| Immigrants | Dominican Republic | 0.0 /100 | #333 | Tragic 49.1% |
| Lumbee | 0.0 /100 | #334 | Tragic 48.9% |
| Yuman | 0.0 /100 | #335 | Tragic 48.7% |
| Spanish American Indians | 0.0 /100 | #336 | Tragic 48.5% |
| Pennsylvania Germans | 0.0 /100 | #337 | Tragic 48.5% |
| Immigrants | Central America | 0.0 /100 | #338 | Tragic 48.5% |
| Immigrants | Azores | 0.0 /100 | #339 | Tragic 48.4% |
| Immigrants | Cabo Verde | 0.0 /100 | #340 | Tragic 48.1% |
| Immigrants | Mexico | 0.0 /100 | #341 | Tragic 47.5% |
| Inupiat | 0.0 /100 | #342 | Tragic 47.2% |
Demographics Similar to Immigrants from Belize by College, 1 year or more
In terms of college, 1 year or more, the demographic groups most similar to Immigrants from Belize are Central American Indian (53.5%, a difference of 0.030%), Immigrants from Guyana (53.5%, a difference of 0.080%), Alaska Native (53.4%, a difference of 0.17%), Immigrants from Ecuador (53.4%, a difference of 0.17%), and Alaskan Athabascan (53.4%, a difference of 0.19%).
| Demographics | Rating | Rank | College, 1 year or more |
| Cheyenne | 0.1 /100 | #280 | Tragic 54.1% |
| Colville | 0.1 /100 | #281 | Tragic 54.1% |
| Guyanese | 0.1 /100 | #282 | Tragic 54.1% |
| Nicaraguans | 0.1 /100 | #283 | Tragic 53.9% |
| Ute | 0.1 /100 | #284 | Tragic 53.8% |
| Immigrants | Guyana | 0.1 /100 | #285 | Tragic 53.5% |
| Central American Indians | 0.1 /100 | #286 | Tragic 53.5% |
| Immigrants | Belize | 0.1 /100 | #287 | Tragic 53.5% |
| Alaska Natives | 0.0 /100 | #288 | Tragic 53.4% |
| Immigrants | Ecuador | 0.0 /100 | #289 | Tragic 53.4% |
| Alaskan Athabascans | 0.0 /100 | #290 | Tragic 53.4% |
| Cubans | 0.0 /100 | #291 | Tragic 53.4% |
| Chickasaw | 0.0 /100 | #292 | Tragic 53.3% |
| Blacks/African Americans | 0.0 /100 | #293 | Tragic 53.3% |
| Cherokee | 0.0 /100 | #294 | Tragic 53.2% |