Yuman vs Immigrants from Croatia College, 1 year or more
COMPARE
Yuman
Immigrants from Croatia
College, 1 year or more
College, 1 year or more Comparison
Yuman
Immigrants from Croatia
48.7%
COLLEGE, 1 YEAR OR MORE
0.0/ 100
METRIC RATING
335th/ 347
METRIC RANK
62.3%
COLLEGE, 1 YEAR OR MORE
97.6/ 100
METRIC RATING
94th/ 347
METRIC RANK
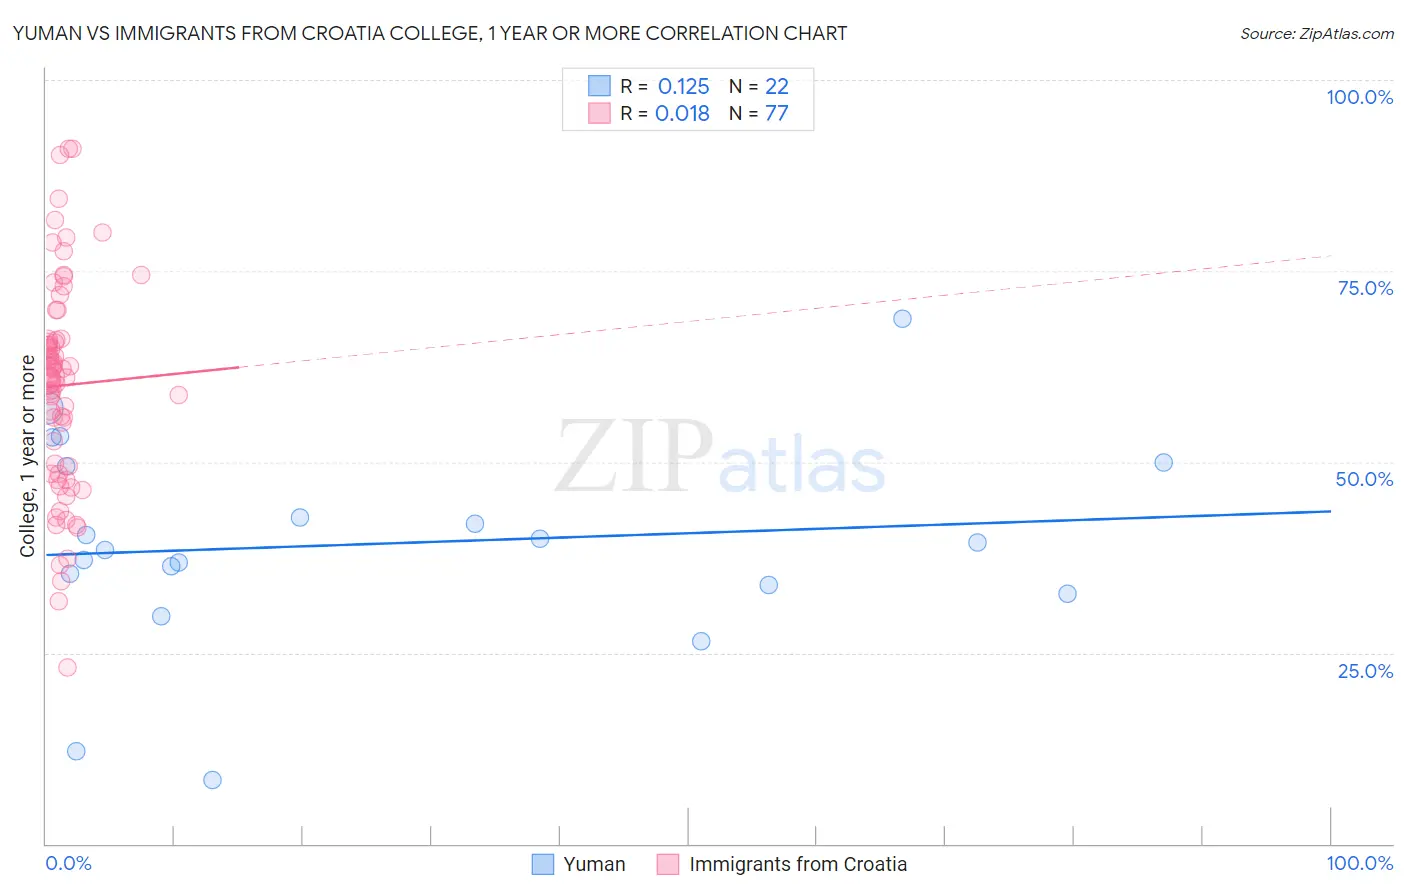
Yuman vs Immigrants from Croatia College, 1 year or more Correlation Chart
The statistical analysis conducted on geographies consisting of 40,696,202 people shows a poor positive correlation between the proportion of Yuman and percentage of population with at least college, 1 year or more education in the United States with a correlation coefficient (R) of 0.125 and weighted average of 48.7%. Similarly, the statistical analysis conducted on geographies consisting of 132,577,989 people shows no correlation between the proportion of Immigrants from Croatia and percentage of population with at least college, 1 year or more education in the United States with a correlation coefficient (R) of 0.018 and weighted average of 62.3%, a difference of 28.0%.
College, 1 year or more Correlation Summary
| Measurement | Yuman | Immigrants from Croatia |
| Minimum | 8.3% | 23.1% |
| Maximum | 68.8% | 91.1% |
| Range | 60.4% | 68.0% |
| Mean | 39.3% | 60.0% |
| Median | 39.0% | 61.2% |
| Interquartile 25% (IQ1) | 34.0% | 49.0% |
| Interquartile 75% (IQ3) | 49.5% | 66.0% |
| Interquartile Range (IQR) | 15.5% | 17.0% |
| Standard Deviation (Sample) | 13.6% | 13.8% |
| Standard Deviation (Population) | 13.3% | 13.7% |
Similar Demographics by College, 1 year or more
Demographics Similar to Yuman by College, 1 year or more
In terms of college, 1 year or more, the demographic groups most similar to Yuman are Lumbee (48.9%, a difference of 0.28%), Spanish American Indian (48.5%, a difference of 0.44%), Pennsylvania German (48.5%, a difference of 0.45%), Immigrants from Central America (48.5%, a difference of 0.50%), and Immigrants from the Azores (48.4%, a difference of 0.76%).
| Demographics | Rating | Rank | College, 1 year or more |
| Dutch West Indians | 0.0 /100 | #328 | Tragic 50.5% |
| Cape Verdeans | 0.0 /100 | #329 | Tragic 50.3% |
| Natives/Alaskans | 0.0 /100 | #330 | Tragic 50.2% |
| Immigrants | Yemen | 0.0 /100 | #331 | Tragic 50.0% |
| Mexicans | 0.0 /100 | #332 | Tragic 49.2% |
| Immigrants | Dominican Republic | 0.0 /100 | #333 | Tragic 49.1% |
| Lumbee | 0.0 /100 | #334 | Tragic 48.9% |
| Yuman | 0.0 /100 | #335 | Tragic 48.7% |
| Spanish American Indians | 0.0 /100 | #336 | Tragic 48.5% |
| Pennsylvania Germans | 0.0 /100 | #337 | Tragic 48.5% |
| Immigrants | Central America | 0.0 /100 | #338 | Tragic 48.5% |
| Immigrants | Azores | 0.0 /100 | #339 | Tragic 48.4% |
| Immigrants | Cabo Verde | 0.0 /100 | #340 | Tragic 48.1% |
| Immigrants | Mexico | 0.0 /100 | #341 | Tragic 47.5% |
| Inupiat | 0.0 /100 | #342 | Tragic 47.2% |
Demographics Similar to Immigrants from Croatia by College, 1 year or more
In terms of college, 1 year or more, the demographic groups most similar to Immigrants from Croatia are Romanian (62.4%, a difference of 0.060%), Immigrants from Eastern Europe (62.4%, a difference of 0.090%), Immigrants from Egypt (62.4%, a difference of 0.090%), British (62.3%, a difference of 0.10%), and Immigrants from Western Asia (62.5%, a difference of 0.20%).
| Demographics | Rating | Rank | College, 1 year or more |
| Immigrants | Hungary | 98.6 /100 | #87 | Exceptional 62.7% |
| Greeks | 98.3 /100 | #88 | Exceptional 62.6% |
| Immigrants | Ethiopia | 98.2 /100 | #89 | Exceptional 62.6% |
| Immigrants | Western Asia | 97.9 /100 | #90 | Exceptional 62.5% |
| Immigrants | Eastern Europe | 97.8 /100 | #91 | Exceptional 62.4% |
| Immigrants | Egypt | 97.8 /100 | #92 | Exceptional 62.4% |
| Romanians | 97.7 /100 | #93 | Exceptional 62.4% |
| Immigrants | Croatia | 97.6 /100 | #94 | Exceptional 62.3% |
| British | 97.4 /100 | #95 | Exceptional 62.3% |
| Chinese | 97.2 /100 | #96 | Exceptional 62.2% |
| Jordanians | 97.2 /100 | #97 | Exceptional 62.2% |
| Carpatho Rusyns | 97.2 /100 | #98 | Exceptional 62.2% |
| Croatians | 97.1 /100 | #99 | Exceptional 62.2% |
| Icelanders | 96.8 /100 | #100 | Exceptional 62.1% |
| Swedes | 96.8 /100 | #101 | Exceptional 62.1% |