Menominee vs Immigrants from West Indies 9th Grade
COMPARE
Menominee
Immigrants from West Indies
9th Grade
9th Grade Comparison
Menominee
Immigrants from West Indies
95.6%
9TH GRADE
98.3/ 100
METRIC RATING
99th/ 347
METRIC RANK
93.3%
9TH GRADE
0.0/ 100
METRIC RATING
289th/ 347
METRIC RANK
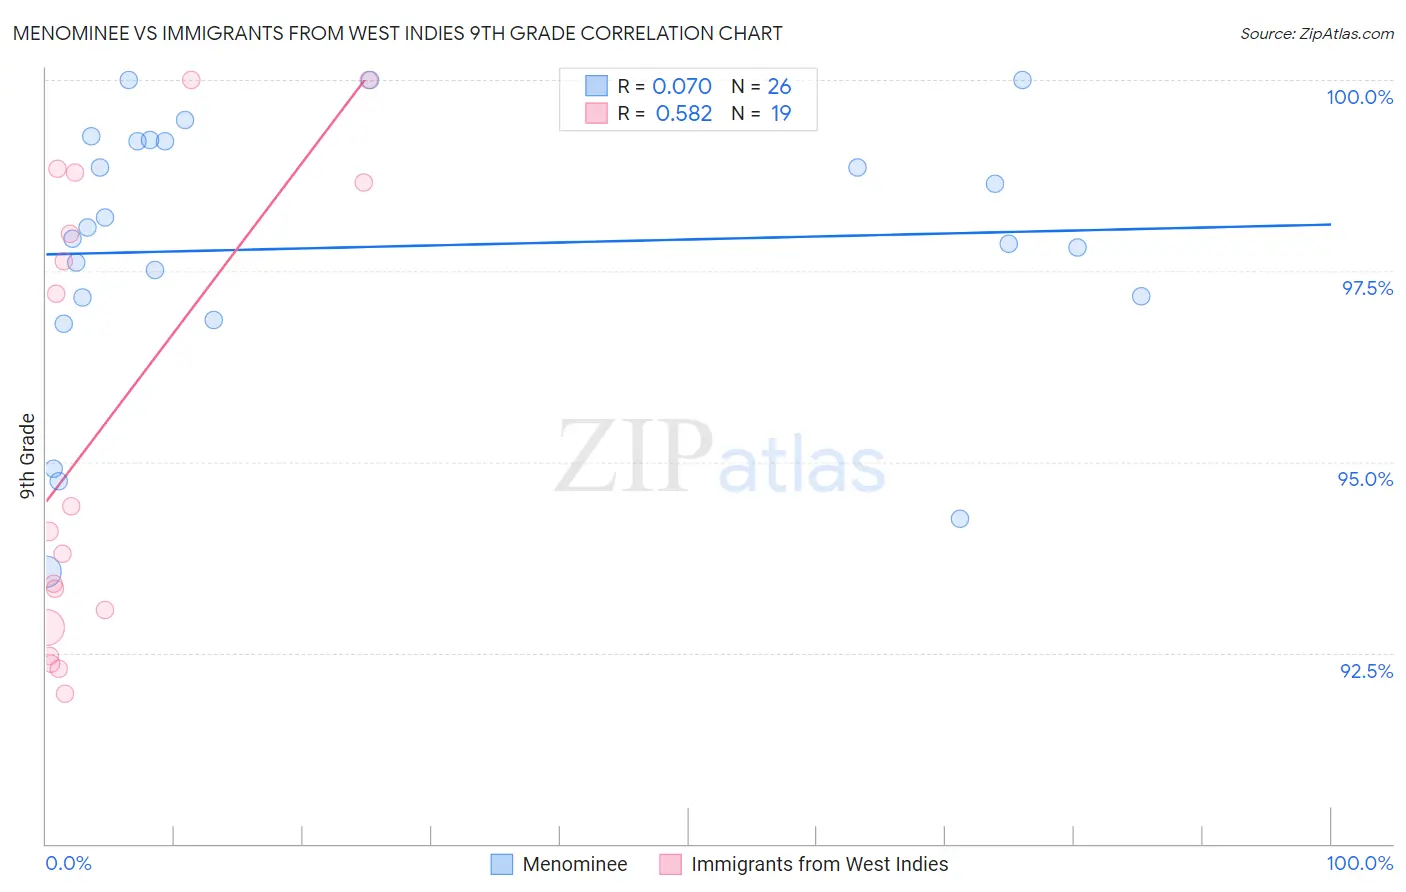
Menominee vs Immigrants from West Indies 9th Grade Correlation Chart
The statistical analysis conducted on geographies consisting of 45,778,979 people shows a slight positive correlation between the proportion of Menominee and percentage of population with at least 9th grade education in the United States with a correlation coefficient (R) of 0.070 and weighted average of 95.6%. Similarly, the statistical analysis conducted on geographies consisting of 72,457,514 people shows a substantial positive correlation between the proportion of Immigrants from West Indies and percentage of population with at least 9th grade education in the United States with a correlation coefficient (R) of 0.582 and weighted average of 93.3%, a difference of 2.5%.
9th Grade Correlation Summary
| Measurement | Menominee | Immigrants from West Indies |
| Minimum | 93.6% | 92.0% |
| Maximum | 100.0% | 100.0% |
| Range | 6.4% | 8.0% |
| Mean | 97.8% | 95.4% |
| Median | 98.0% | 94.1% |
| Interquartile 25% (IQ1) | 97.2% | 92.8% |
| Interquartile 75% (IQ3) | 99.2% | 98.7% |
| Interquartile Range (IQR) | 2.1% | 5.8% |
| Standard Deviation (Sample) | 1.8% | 2.9% |
| Standard Deviation (Population) | 1.7% | 2.9% |
Similar Demographics by 9th Grade
Demographics Similar to Menominee by 9th Grade
In terms of 9th grade, the demographic groups most similar to Menominee are Immigrants from Japan (95.6%, a difference of 0.0%), Delaware (95.6%, a difference of 0.010%), American (95.6%, a difference of 0.020%), Filipino (95.6%, a difference of 0.020%), and Lebanese (95.6%, a difference of 0.020%).
| Demographics | Rating | Rank | 9th Grade |
| Immigrants | Saudi Arabia | 98.8 /100 | #92 | Exceptional 95.6% |
| Immigrants | Germany | 98.7 /100 | #93 | Exceptional 95.6% |
| Immigrants | Latvia | 98.7 /100 | #94 | Exceptional 95.6% |
| Americans | 98.5 /100 | #95 | Exceptional 95.6% |
| Filipinos | 98.5 /100 | #96 | Exceptional 95.6% |
| Delaware | 98.4 /100 | #97 | Exceptional 95.6% |
| Immigrants | Japan | 98.4 /100 | #98 | Exceptional 95.6% |
| Menominee | 98.3 /100 | #99 | Exceptional 95.6% |
| Lebanese | 98.1 /100 | #100 | Exceptional 95.6% |
| Immigrants | Moldova | 97.9 /100 | #101 | Exceptional 95.5% |
| Immigrants | Switzerland | 97.7 /100 | #102 | Exceptional 95.5% |
| Potawatomi | 97.7 /100 | #103 | Exceptional 95.5% |
| Syrians | 97.4 /100 | #104 | Exceptional 95.5% |
| Immigrants | France | 97.4 /100 | #105 | Exceptional 95.5% |
| Immigrants | Norway | 97.1 /100 | #106 | Exceptional 95.5% |
Demographics Similar to Immigrants from West Indies by 9th Grade
In terms of 9th grade, the demographic groups most similar to Immigrants from West Indies are Pennsylvania German (93.3%, a difference of 0.0%), Immigrants from South Eastern Asia (93.3%, a difference of 0.060%), Immigrants from St. Vincent and the Grenadines (93.4%, a difference of 0.090%), British West Indian (93.2%, a difference of 0.090%), and Immigrants from Barbados (93.4%, a difference of 0.10%).
| Demographics | Rating | Rank | 9th Grade |
| Malaysians | 0.0 /100 | #282 | Tragic 93.5% |
| Barbadians | 0.0 /100 | #283 | Tragic 93.5% |
| Bangladeshis | 0.0 /100 | #284 | Tragic 93.4% |
| Immigrants | Peru | 0.0 /100 | #285 | Tragic 93.4% |
| Immigrants | Barbados | 0.0 /100 | #286 | Tragic 93.4% |
| Immigrants | St. Vincent and the Grenadines | 0.0 /100 | #287 | Tragic 93.4% |
| Immigrants | South Eastern Asia | 0.0 /100 | #288 | Tragic 93.3% |
| Immigrants | West Indies | 0.0 /100 | #289 | Tragic 93.3% |
| Pennsylvania Germans | 0.0 /100 | #290 | Tragic 93.3% |
| British West Indians | 0.0 /100 | #291 | Tragic 93.2% |
| Immigrants | Laos | 0.0 /100 | #292 | Tragic 93.2% |
| Sri Lankans | 0.0 /100 | #293 | Tragic 93.2% |
| Cubans | 0.0 /100 | #294 | Tragic 93.2% |
| Immigrants | Burma/Myanmar | 0.0 /100 | #295 | Tragic 93.1% |
| Indonesians | 0.0 /100 | #296 | Tragic 93.1% |