Immigrants from Eastern Asia vs Immigrants from West Indies 9th Grade
COMPARE
Immigrants from Eastern Asia
Immigrants from West Indies
9th Grade
9th Grade Comparison
Immigrants from Eastern Asia
Immigrants from West Indies
94.6%
9TH GRADE
19.8/ 100
METRIC RATING
202nd/ 347
METRIC RANK
93.3%
9TH GRADE
0.0/ 100
METRIC RATING
289th/ 347
METRIC RANK
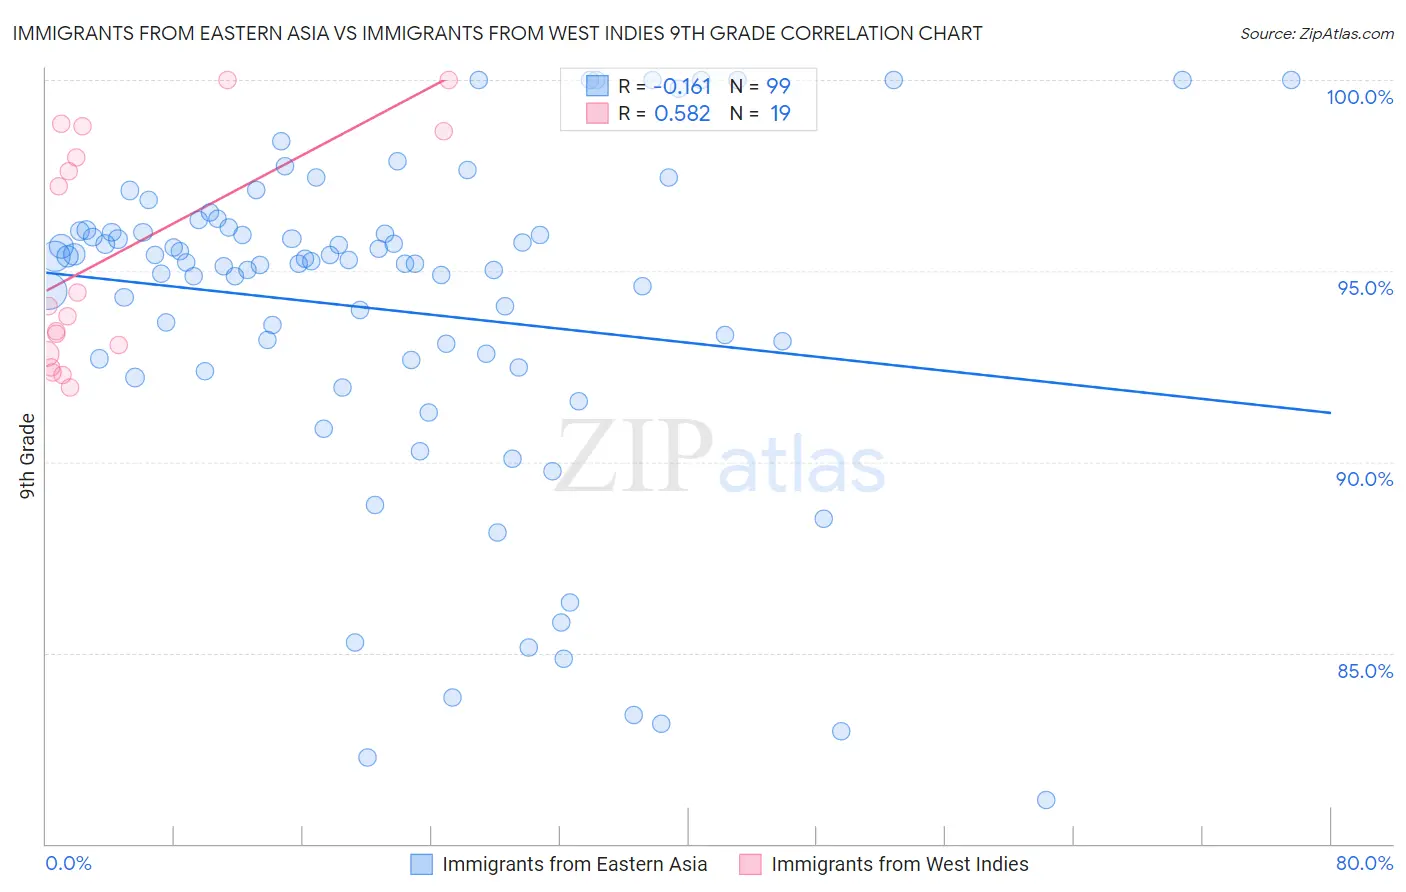
Immigrants from Eastern Asia vs Immigrants from West Indies 9th Grade Correlation Chart
The statistical analysis conducted on geographies consisting of 499,846,352 people shows a poor negative correlation between the proportion of Immigrants from Eastern Asia and percentage of population with at least 9th grade education in the United States with a correlation coefficient (R) of -0.161 and weighted average of 94.6%. Similarly, the statistical analysis conducted on geographies consisting of 72,457,514 people shows a substantial positive correlation between the proportion of Immigrants from West Indies and percentage of population with at least 9th grade education in the United States with a correlation coefficient (R) of 0.582 and weighted average of 93.3%, a difference of 1.5%.
9th Grade Correlation Summary
| Measurement | Immigrants from Eastern Asia | Immigrants from West Indies |
| Minimum | 81.1% | 92.0% |
| Maximum | 100.0% | 100.0% |
| Range | 18.9% | 8.0% |
| Mean | 94.0% | 95.4% |
| Median | 95.2% | 94.1% |
| Interquartile 25% (IQ1) | 92.7% | 92.8% |
| Interquartile 75% (IQ3) | 96.0% | 98.7% |
| Interquartile Range (IQR) | 3.4% | 5.8% |
| Standard Deviation (Sample) | 4.4% | 2.9% |
| Standard Deviation (Population) | 4.4% | 2.9% |
Similar Demographics by 9th Grade
Demographics Similar to Immigrants from Eastern Asia by 9th Grade
In terms of 9th grade, the demographic groups most similar to Immigrants from Eastern Asia are Immigrants from Bahamas (94.6%, a difference of 0.0%), Moroccan (94.6%, a difference of 0.0%), Laotian (94.6%, a difference of 0.010%), Immigrants from Zaire (94.6%, a difference of 0.010%), and Black/African American (94.6%, a difference of 0.010%).
| Demographics | Rating | Rank | 9th Grade |
| Marshallese | 27.9 /100 | #195 | Fair 94.7% |
| Immigrants | Lebanon | 27.2 /100 | #196 | Fair 94.7% |
| Immigrants | Micronesia | 24.7 /100 | #197 | Fair 94.7% |
| Hawaiians | 22.7 /100 | #198 | Fair 94.7% |
| Laotians | 21.0 /100 | #199 | Fair 94.6% |
| Immigrants | Zaire | 20.6 /100 | #200 | Fair 94.6% |
| Blacks/African Americans | 20.5 /100 | #201 | Fair 94.6% |
| Immigrants | Eastern Asia | 19.8 /100 | #202 | Poor 94.6% |
| Immigrants | Bahamas | 19.8 /100 | #203 | Poor 94.6% |
| Moroccans | 19.6 /100 | #204 | Poor 94.6% |
| Immigrants | Sudan | 17.6 /100 | #205 | Poor 94.6% |
| Samoans | 17.3 /100 | #206 | Poor 94.6% |
| Immigrants | Morocco | 16.3 /100 | #207 | Poor 94.6% |
| Immigrants | Pakistan | 15.5 /100 | #208 | Poor 94.6% |
| Comanche | 14.9 /100 | #209 | Poor 94.6% |
Demographics Similar to Immigrants from West Indies by 9th Grade
In terms of 9th grade, the demographic groups most similar to Immigrants from West Indies are Pennsylvania German (93.3%, a difference of 0.0%), Immigrants from South Eastern Asia (93.3%, a difference of 0.060%), Immigrants from St. Vincent and the Grenadines (93.4%, a difference of 0.090%), British West Indian (93.2%, a difference of 0.090%), and Immigrants from Barbados (93.4%, a difference of 0.10%).
| Demographics | Rating | Rank | 9th Grade |
| Malaysians | 0.0 /100 | #282 | Tragic 93.5% |
| Barbadians | 0.0 /100 | #283 | Tragic 93.5% |
| Bangladeshis | 0.0 /100 | #284 | Tragic 93.4% |
| Immigrants | Peru | 0.0 /100 | #285 | Tragic 93.4% |
| Immigrants | Barbados | 0.0 /100 | #286 | Tragic 93.4% |
| Immigrants | St. Vincent and the Grenadines | 0.0 /100 | #287 | Tragic 93.4% |
| Immigrants | South Eastern Asia | 0.0 /100 | #288 | Tragic 93.3% |
| Immigrants | West Indies | 0.0 /100 | #289 | Tragic 93.3% |
| Pennsylvania Germans | 0.0 /100 | #290 | Tragic 93.3% |
| British West Indians | 0.0 /100 | #291 | Tragic 93.2% |
| Immigrants | Laos | 0.0 /100 | #292 | Tragic 93.2% |
| Sri Lankans | 0.0 /100 | #293 | Tragic 93.2% |
| Cubans | 0.0 /100 | #294 | Tragic 93.2% |
| Immigrants | Burma/Myanmar | 0.0 /100 | #295 | Tragic 93.1% |
| Indonesians | 0.0 /100 | #296 | Tragic 93.1% |