Yuman vs Immigrants from Afghanistan 9th Grade
COMPARE
Yuman
Immigrants from Afghanistan
9th Grade
9th Grade Comparison
Yuman
Immigrants from Afghanistan
93.8%
9TH GRADE
0.2/ 100
METRIC RATING
270th/ 347
METRIC RANK
94.0%
9TH GRADE
0.5/ 100
METRIC RATING
256th/ 347
METRIC RANK
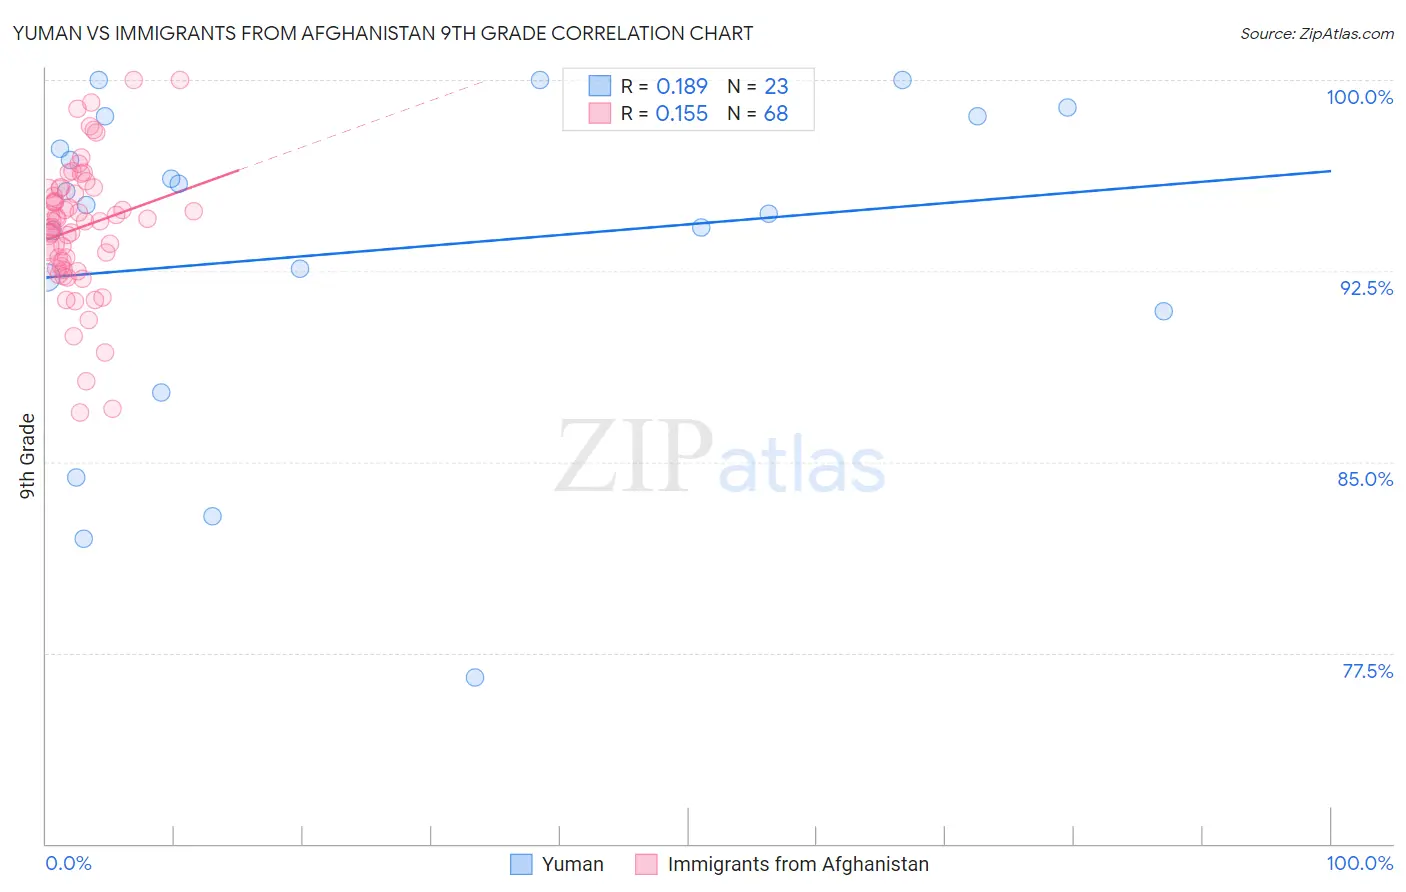
Yuman vs Immigrants from Afghanistan 9th Grade Correlation Chart
The statistical analysis conducted on geographies consisting of 40,696,349 people shows a poor positive correlation between the proportion of Yuman and percentage of population with at least 9th grade education in the United States with a correlation coefficient (R) of 0.189 and weighted average of 93.8%. Similarly, the statistical analysis conducted on geographies consisting of 147,629,924 people shows a poor positive correlation between the proportion of Immigrants from Afghanistan and percentage of population with at least 9th grade education in the United States with a correlation coefficient (R) of 0.155 and weighted average of 94.0%, a difference of 0.17%.
9th Grade Correlation Summary
| Measurement | Yuman | Immigrants from Afghanistan |
| Minimum | 76.5% | 86.9% |
| Maximum | 100.0% | 100.0% |
| Range | 23.5% | 13.1% |
| Mean | 93.3% | 94.2% |
| Median | 95.1% | 94.5% |
| Interquartile 25% (IQ1) | 90.9% | 92.7% |
| Interquartile 75% (IQ3) | 98.6% | 95.7% |
| Interquartile Range (IQR) | 7.7% | 3.1% |
| Standard Deviation (Sample) | 6.4% | 2.7% |
| Standard Deviation (Population) | 6.3% | 2.6% |
Demographics Similar to Yuman and Immigrants from Afghanistan by 9th Grade
In terms of 9th grade, the demographic groups most similar to Yuman are Immigrants from Uruguay (93.8%, a difference of 0.010%), Immigrants from Ghana (93.8%, a difference of 0.020%), Immigrants from Western Africa (93.8%, a difference of 0.030%), Immigrants from South America (93.8%, a difference of 0.040%), and Immigrants from Bolivia (93.9%, a difference of 0.050%). Similarly, the demographic groups most similar to Immigrants from Afghanistan are Immigrants from Nigeria (94.0%, a difference of 0.010%), Immigrants from Costa Rica (94.0%, a difference of 0.020%), Immigrants from Thailand (93.9%, a difference of 0.020%), Ghanaian (93.9%, a difference of 0.020%), and Pima (93.9%, a difference of 0.040%).
| Demographics | Rating | Rank | 9th Grade |
| Colombians | 0.8 /100 | #253 | Tragic 94.0% |
| U.S. Virgin Islanders | 0.7 /100 | #254 | Tragic 94.0% |
| Immigrants | Nigeria | 0.6 /100 | #255 | Tragic 94.0% |
| Immigrants | Afghanistan | 0.5 /100 | #256 | Tragic 94.0% |
| Immigrants | Costa Rica | 0.5 /100 | #257 | Tragic 94.0% |
| Immigrants | Thailand | 0.5 /100 | #258 | Tragic 93.9% |
| Ghanaians | 0.5 /100 | #259 | Tragic 93.9% |
| Pima | 0.4 /100 | #260 | Tragic 93.9% |
| South Americans | 0.4 /100 | #261 | Tragic 93.9% |
| Immigrants | Jamaica | 0.4 /100 | #262 | Tragic 93.9% |
| Immigrants | Uzbekistan | 0.4 /100 | #263 | Tragic 93.9% |
| Immigrants | Congo | 0.4 /100 | #264 | Tragic 93.9% |
| Natives/Alaskans | 0.4 /100 | #265 | Tragic 93.9% |
| Navajo | 0.3 /100 | #266 | Tragic 93.9% |
| Armenians | 0.3 /100 | #267 | Tragic 93.9% |
| Immigrants | Bolivia | 0.3 /100 | #268 | Tragic 93.9% |
| Immigrants | Uruguay | 0.2 /100 | #269 | Tragic 93.8% |
| Yuman | 0.2 /100 | #270 | Tragic 93.8% |
| Immigrants | Ghana | 0.2 /100 | #271 | Tragic 93.8% |
| Immigrants | Western Africa | 0.2 /100 | #272 | Tragic 93.8% |
| Immigrants | South America | 0.2 /100 | #273 | Tragic 93.8% |