Cajun vs Immigrants from West Indies 9th Grade
COMPARE
Cajun
Immigrants from West Indies
9th Grade
9th Grade Comparison
Cajuns
Immigrants from West Indies
95.1%
9TH GRADE
77.3/ 100
METRIC RATING
151st/ 347
METRIC RANK
93.3%
9TH GRADE
0.0/ 100
METRIC RATING
289th/ 347
METRIC RANK
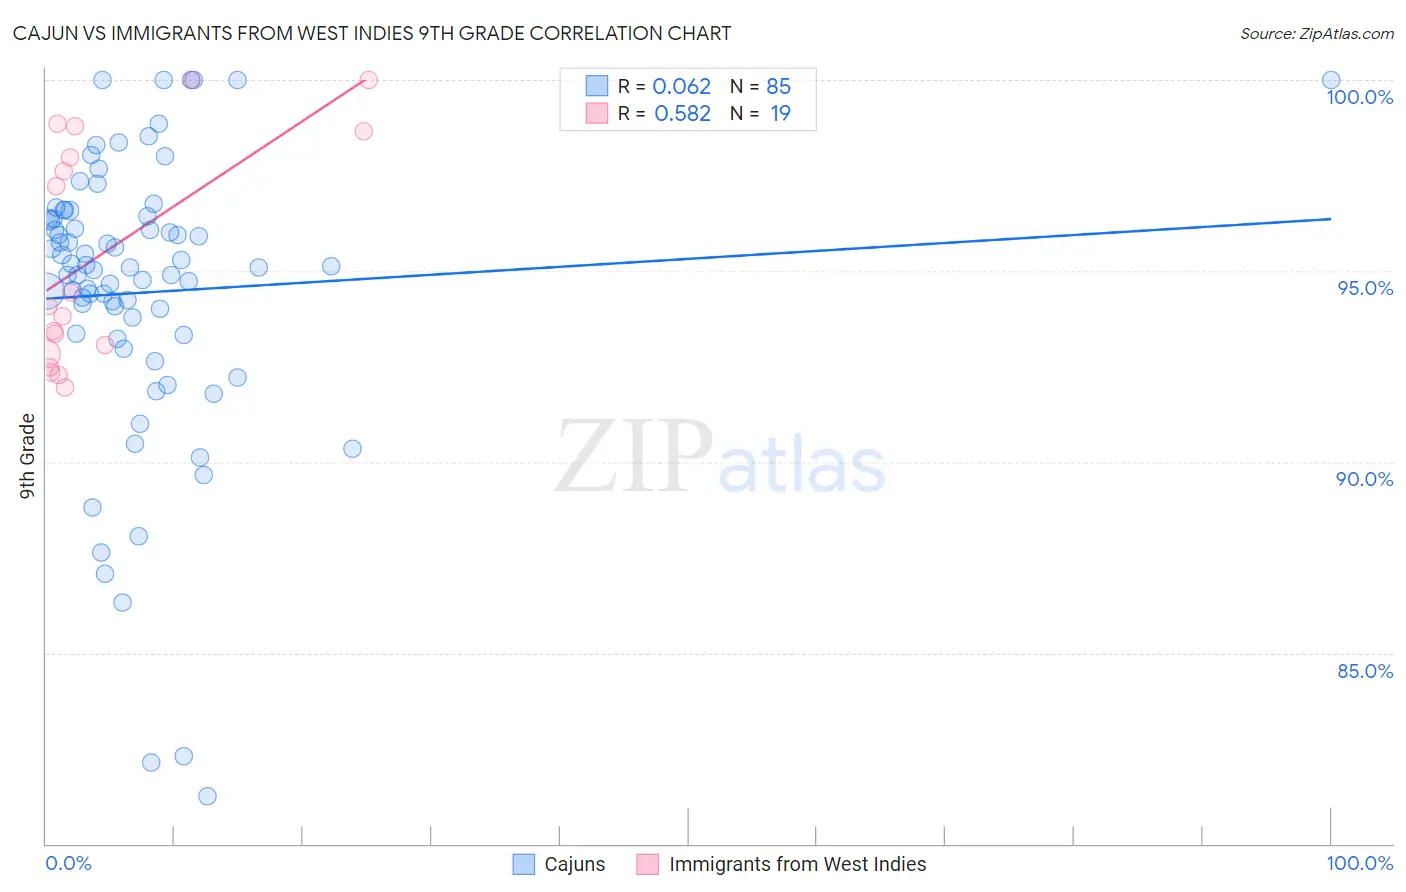
Cajun vs Immigrants from West Indies 9th Grade Correlation Chart
The statistical analysis conducted on geographies consisting of 149,711,516 people shows a slight positive correlation between the proportion of Cajuns and percentage of population with at least 9th grade education in the United States with a correlation coefficient (R) of 0.062 and weighted average of 95.1%. Similarly, the statistical analysis conducted on geographies consisting of 72,457,514 people shows a substantial positive correlation between the proportion of Immigrants from West Indies and percentage of population with at least 9th grade education in the United States with a correlation coefficient (R) of 0.582 and weighted average of 93.3%, a difference of 1.9%.
9th Grade Correlation Summary
| Measurement | Cajun | Immigrants from West Indies |
| Minimum | 81.2% | 92.0% |
| Maximum | 100.0% | 100.0% |
| Range | 18.8% | 8.0% |
| Mean | 94.4% | 95.4% |
| Median | 95.1% | 94.1% |
| Interquartile 25% (IQ1) | 93.3% | 92.8% |
| Interquartile 75% (IQ3) | 96.4% | 98.7% |
| Interquartile Range (IQR) | 3.1% | 5.8% |
| Standard Deviation (Sample) | 3.8% | 2.9% |
| Standard Deviation (Population) | 3.8% | 2.9% |
Similar Demographics by 9th Grade
Demographics Similar to Cajuns by 9th Grade
In terms of 9th grade, the demographic groups most similar to Cajuns are Ugandan (95.1%, a difference of 0.0%), Albanian (95.1%, a difference of 0.010%), Immigrants from Korea (95.1%, a difference of 0.020%), Kenyan (95.1%, a difference of 0.020%), and Arab (95.1%, a difference of 0.030%).
| Demographics | Rating | Rank | 9th Grade |
| Yup'ik | 83.3 /100 | #144 | Excellent 95.2% |
| Pueblo | 82.2 /100 | #145 | Excellent 95.1% |
| Immigrants | Sri Lanka | 82.1 /100 | #146 | Excellent 95.1% |
| Choctaw | 81.9 /100 | #147 | Excellent 95.1% |
| Immigrants | Jordan | 81.2 /100 | #148 | Excellent 95.1% |
| Immigrants | Korea | 79.6 /100 | #149 | Good 95.1% |
| Kenyans | 79.1 /100 | #150 | Good 95.1% |
| Cajuns | 77.3 /100 | #151 | Good 95.1% |
| Ugandans | 77.0 /100 | #152 | Good 95.1% |
| Albanians | 76.1 /100 | #153 | Good 95.1% |
| Arabs | 74.9 /100 | #154 | Good 95.1% |
| Immigrants | Kazakhstan | 74.7 /100 | #155 | Good 95.1% |
| Immigrants | Kenya | 73.1 /100 | #156 | Good 95.0% |
| Mongolians | 73.0 /100 | #157 | Good 95.0% |
| Egyptians | 70.1 /100 | #158 | Good 95.0% |
Demographics Similar to Immigrants from West Indies by 9th Grade
In terms of 9th grade, the demographic groups most similar to Immigrants from West Indies are Pennsylvania German (93.3%, a difference of 0.0%), Immigrants from South Eastern Asia (93.3%, a difference of 0.060%), Immigrants from St. Vincent and the Grenadines (93.4%, a difference of 0.090%), British West Indian (93.2%, a difference of 0.090%), and Immigrants from Barbados (93.4%, a difference of 0.10%).
| Demographics | Rating | Rank | 9th Grade |
| Malaysians | 0.0 /100 | #282 | Tragic 93.5% |
| Barbadians | 0.0 /100 | #283 | Tragic 93.5% |
| Bangladeshis | 0.0 /100 | #284 | Tragic 93.4% |
| Immigrants | Peru | 0.0 /100 | #285 | Tragic 93.4% |
| Immigrants | Barbados | 0.0 /100 | #286 | Tragic 93.4% |
| Immigrants | St. Vincent and the Grenadines | 0.0 /100 | #287 | Tragic 93.4% |
| Immigrants | South Eastern Asia | 0.0 /100 | #288 | Tragic 93.3% |
| Immigrants | West Indies | 0.0 /100 | #289 | Tragic 93.3% |
| Pennsylvania Germans | 0.0 /100 | #290 | Tragic 93.3% |
| British West Indians | 0.0 /100 | #291 | Tragic 93.2% |
| Immigrants | Laos | 0.0 /100 | #292 | Tragic 93.2% |
| Sri Lankans | 0.0 /100 | #293 | Tragic 93.2% |
| Cubans | 0.0 /100 | #294 | Tragic 93.2% |
| Immigrants | Burma/Myanmar | 0.0 /100 | #295 | Tragic 93.1% |
| Indonesians | 0.0 /100 | #296 | Tragic 93.1% |