Yuman vs Sierra Leonean 9th Grade
COMPARE
Yuman
Sierra Leonean
9th Grade
9th Grade Comparison
Yuman
Sierra Leoneans
93.8%
9TH GRADE
0.2/ 100
METRIC RATING
270th/ 347
METRIC RANK
94.8%
9TH GRADE
42.7/ 100
METRIC RATING
181st/ 347
METRIC RANK
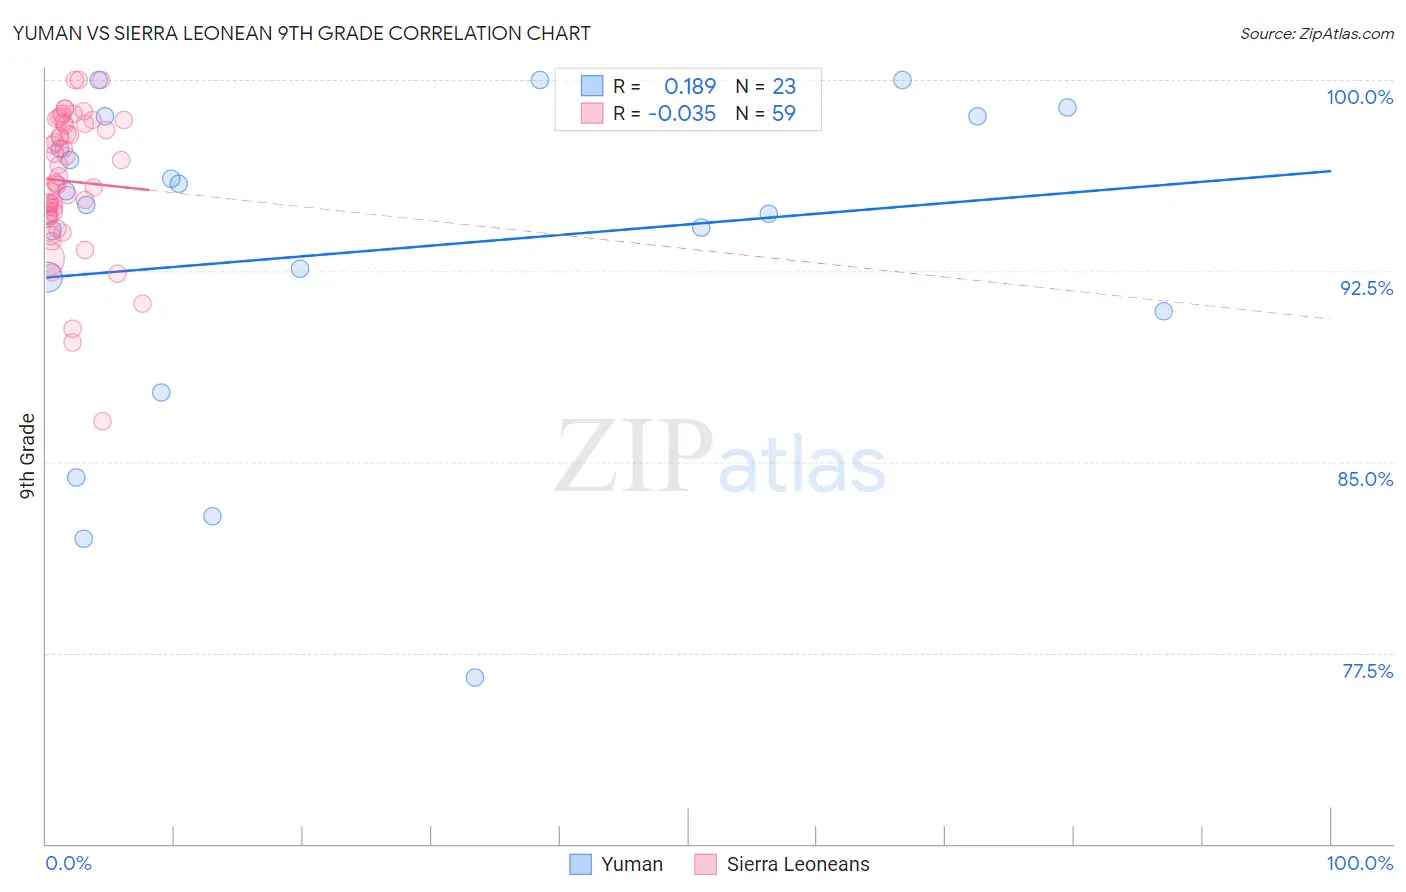
Yuman vs Sierra Leonean 9th Grade Correlation Chart
The statistical analysis conducted on geographies consisting of 40,696,349 people shows a poor positive correlation between the proportion of Yuman and percentage of population with at least 9th grade education in the United States with a correlation coefficient (R) of 0.189 and weighted average of 93.8%. Similarly, the statistical analysis conducted on geographies consisting of 83,357,120 people shows no correlation between the proportion of Sierra Leoneans and percentage of population with at least 9th grade education in the United States with a correlation coefficient (R) of -0.035 and weighted average of 94.8%, a difference of 1.1%.
9th Grade Correlation Summary
| Measurement | Yuman | Sierra Leonean |
| Minimum | 76.5% | 86.6% |
| Maximum | 100.0% | 100.0% |
| Range | 23.5% | 13.4% |
| Mean | 93.3% | 96.0% |
| Median | 95.1% | 96.0% |
| Interquartile 25% (IQ1) | 90.9% | 94.7% |
| Interquartile 75% (IQ3) | 98.6% | 98.3% |
| Interquartile Range (IQR) | 7.7% | 3.6% |
| Standard Deviation (Sample) | 6.4% | 2.7% |
| Standard Deviation (Population) | 6.3% | 2.7% |
Similar Demographics by 9th Grade
Demographics Similar to Yuman by 9th Grade
In terms of 9th grade, the demographic groups most similar to Yuman are Immigrants from Uruguay (93.8%, a difference of 0.010%), Immigrants from Ghana (93.8%, a difference of 0.020%), Immigrants from Western Africa (93.8%, a difference of 0.030%), Immigrants from South America (93.8%, a difference of 0.040%), and Peruvian (93.8%, a difference of 0.040%).
| Demographics | Rating | Rank | 9th Grade |
| Immigrants | Uzbekistan | 0.4 /100 | #263 | Tragic 93.9% |
| Immigrants | Congo | 0.4 /100 | #264 | Tragic 93.9% |
| Natives/Alaskans | 0.4 /100 | #265 | Tragic 93.9% |
| Navajo | 0.3 /100 | #266 | Tragic 93.9% |
| Armenians | 0.3 /100 | #267 | Tragic 93.9% |
| Immigrants | Bolivia | 0.3 /100 | #268 | Tragic 93.9% |
| Immigrants | Uruguay | 0.2 /100 | #269 | Tragic 93.8% |
| Yuman | 0.2 /100 | #270 | Tragic 93.8% |
| Immigrants | Ghana | 0.2 /100 | #271 | Tragic 93.8% |
| Immigrants | Western Africa | 0.2 /100 | #272 | Tragic 93.8% |
| Immigrants | South America | 0.2 /100 | #273 | Tragic 93.8% |
| Peruvians | 0.2 /100 | #274 | Tragic 93.8% |
| Immigrants | Colombia | 0.2 /100 | #275 | Tragic 93.8% |
| West Indians | 0.2 /100 | #276 | Tragic 93.7% |
| Immigrants | Philippines | 0.1 /100 | #277 | Tragic 93.7% |
Demographics Similar to Sierra Leoneans by 9th Grade
In terms of 9th grade, the demographic groups most similar to Sierra Leoneans are Immigrants from Uganda (94.8%, a difference of 0.0%), Seminole (94.8%, a difference of 0.0%), Immigrants from Nepal (94.8%, a difference of 0.020%), Immigrants from Poland (94.9%, a difference of 0.030%), and Immigrants from Venezuela (94.9%, a difference of 0.030%).
| Demographics | Rating | Rank | 9th Grade |
| Immigrants | Egypt | 50.0 /100 | #174 | Average 94.9% |
| Brazilians | 49.8 /100 | #175 | Average 94.9% |
| Immigrants | Spain | 49.1 /100 | #176 | Average 94.9% |
| Immigrants | Iraq | 47.8 /100 | #177 | Average 94.9% |
| Immigrants | Poland | 46.7 /100 | #178 | Average 94.9% |
| Immigrants | Venezuela | 46.5 /100 | #179 | Average 94.9% |
| Immigrants | Uganda | 43.1 /100 | #180 | Average 94.8% |
| Sierra Leoneans | 42.7 /100 | #181 | Average 94.8% |
| Seminole | 42.5 /100 | #182 | Average 94.8% |
| Immigrants | Nepal | 39.7 /100 | #183 | Fair 94.8% |
| Argentineans | 37.6 /100 | #184 | Fair 94.8% |
| Liberians | 37.4 /100 | #185 | Fair 94.8% |
| Hopi | 37.1 /100 | #186 | Fair 94.8% |
| Guamanians/Chamorros | 35.5 /100 | #187 | Fair 94.8% |
| Immigrants | Albania | 34.5 /100 | #188 | Fair 94.8% |