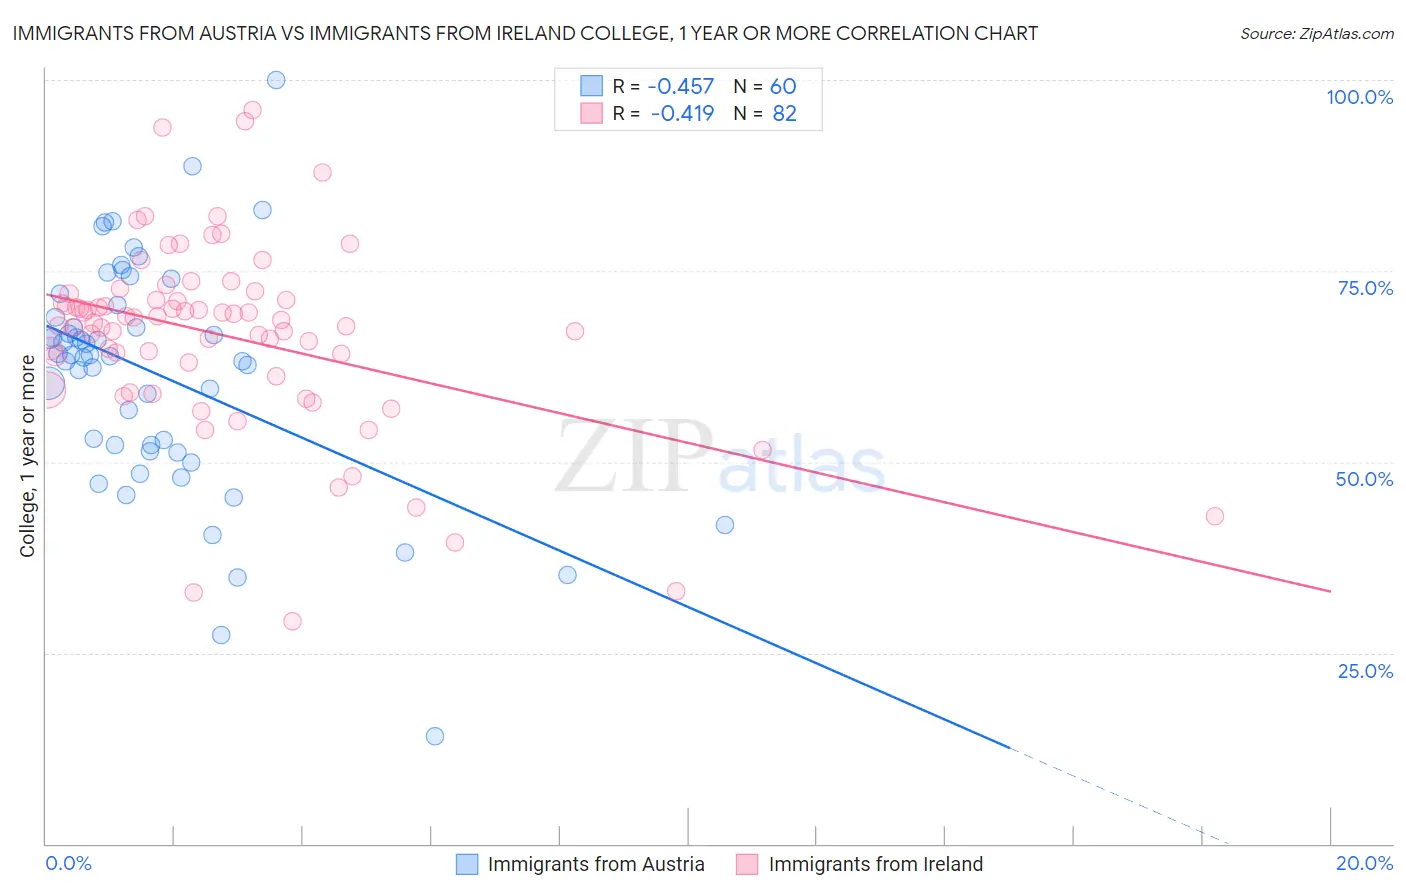
Immigrants from Austria vs Immigrants from Ireland College, 1 year or more
COMPARE
Immigrants from Austria
Immigrants from Ireland
College, 1 year or more
College, 1 year or more Comparison
Immigrants from Austria
Immigrants from Ireland
64.4%
COLLEGE, 1 YEAR OR MORE
99.8/ 100
METRIC RATING
50th/ 347
METRIC RANK
65.9%
COLLEGE, 1 YEAR OR MORE
100.0/ 100
METRIC RATING
27th/ 347
METRIC RANK
Immigrants from Austria vs Immigrants from Ireland College, 1 year or more Correlation Chart
The statistical analysis conducted on geographies consisting of 167,973,933 people shows a moderate negative correlation between the proportion of Immigrants from Austria and percentage of population with at least college, 1 year or more education in the United States with a correlation coefficient (R) of -0.457 and weighted average of 64.4%. Similarly, the statistical analysis conducted on geographies consisting of 240,784,591 people shows a moderate negative correlation between the proportion of Immigrants from Ireland and percentage of population with at least college, 1 year or more education in the United States with a correlation coefficient (R) of -0.419 and weighted average of 65.9%, a difference of 2.4%.
College, 1 year or more Correlation Summary
| Measurement | Immigrants from Austria | Immigrants from Ireland |
| Minimum | 14.1% | 29.2% |
| Maximum | 100.0% | 96.0% |
| Range | 85.9% | 66.9% |
| Mean | 61.4% | 66.5% |
| Median | 63.9% | 68.4% |
| Interquartile 25% (IQ1) | 51.8% | 61.1% |
| Interquartile 75% (IQ3) | 69.7% | 71.3% |
| Interquartile Range (IQR) | 17.9% | 10.1% |
| Standard Deviation (Sample) | 15.3% | 12.4% |
| Standard Deviation (Population) | 15.1% | 12.4% |
Similar Demographics by College, 1 year or more
Demographics Similar to Immigrants from Austria by College, 1 year or more
In terms of college, 1 year or more, the demographic groups most similar to Immigrants from Austria are Immigrants from Malaysia (64.3%, a difference of 0.080%), Immigrants from Netherlands (64.2%, a difference of 0.24%), Asian (64.2%, a difference of 0.26%), New Zealander (64.6%, a difference of 0.29%), and Zimbabwean (64.2%, a difference of 0.29%).
| Demographics | Rating | Rank | College, 1 year or more |
| Immigrants | Russia | 99.9 /100 | #43 | Exceptional 64.7% |
| Immigrants | Norway | 99.9 /100 | #44 | Exceptional 64.7% |
| Immigrants | Lithuania | 99.9 /100 | #45 | Exceptional 64.6% |
| Bhutanese | 99.9 /100 | #46 | Exceptional 64.6% |
| Australians | 99.9 /100 | #47 | Exceptional 64.6% |
| Immigrants | Bulgaria | 99.9 /100 | #48 | Exceptional 64.6% |
| New Zealanders | 99.9 /100 | #49 | Exceptional 64.6% |
| Immigrants | Austria | 99.8 /100 | #50 | Exceptional 64.4% |
| Immigrants | Malaysia | 99.8 /100 | #51 | Exceptional 64.3% |
| Immigrants | Netherlands | 99.8 /100 | #52 | Exceptional 64.2% |
| Asians | 99.8 /100 | #53 | Exceptional 64.2% |
| Zimbabweans | 99.8 /100 | #54 | Exceptional 64.2% |
| Immigrants | Belarus | 99.7 /100 | #55 | Exceptional 64.1% |
| Immigrants | Czechoslovakia | 99.7 /100 | #56 | Exceptional 64.1% |
| South Africans | 99.7 /100 | #57 | Exceptional 64.1% |
Demographics Similar to Immigrants from Ireland by College, 1 year or more
In terms of college, 1 year or more, the demographic groups most similar to Immigrants from Ireland are Immigrants from France (65.8%, a difference of 0.17%), Latvian (66.1%, a difference of 0.20%), Indian (Asian) (66.1%, a difference of 0.24%), Immigrants from Northern Europe (65.6%, a difference of 0.42%), and Immigrants from Denmark (65.6%, a difference of 0.53%).
| Demographics | Rating | Rank | College, 1 year or more |
| Immigrants | Korea | 100.0 /100 | #20 | Exceptional 66.5% |
| Immigrants | Hong Kong | 100.0 /100 | #21 | Exceptional 66.4% |
| Soviet Union | 100.0 /100 | #22 | Exceptional 66.4% |
| Immigrants | China | 100.0 /100 | #23 | Exceptional 66.4% |
| Immigrants | Belgium | 100.0 /100 | #24 | Exceptional 66.3% |
| Indians (Asian) | 100.0 /100 | #25 | Exceptional 66.1% |
| Latvians | 100.0 /100 | #26 | Exceptional 66.1% |
| Immigrants | Ireland | 100.0 /100 | #27 | Exceptional 65.9% |
| Immigrants | France | 100.0 /100 | #28 | Exceptional 65.8% |
| Immigrants | Northern Europe | 100.0 /100 | #29 | Exceptional 65.6% |
| Immigrants | Denmark | 100.0 /100 | #30 | Exceptional 65.6% |
| Turks | 100.0 /100 | #31 | Exceptional 65.5% |
| Bulgarians | 100.0 /100 | #32 | Exceptional 65.5% |
| Immigrants | Sri Lanka | 99.9 /100 | #33 | Exceptional 65.4% |
| Israelis | 99.9 /100 | #34 | Exceptional 65.3% |