Yuman vs Comanche Disability Age Over 75
COMPARE
Yuman
Comanche
Disability Age Over 75
Disability Age Over 75 Comparison
Yuman
Comanche
54.4%
DISABILITY AGE OVER 75
0.0/ 100
METRIC RATING
337th/ 347
METRIC RANK
51.7%
DISABILITY AGE OVER 75
0.0/ 100
METRIC RATING
322nd/ 347
METRIC RANK
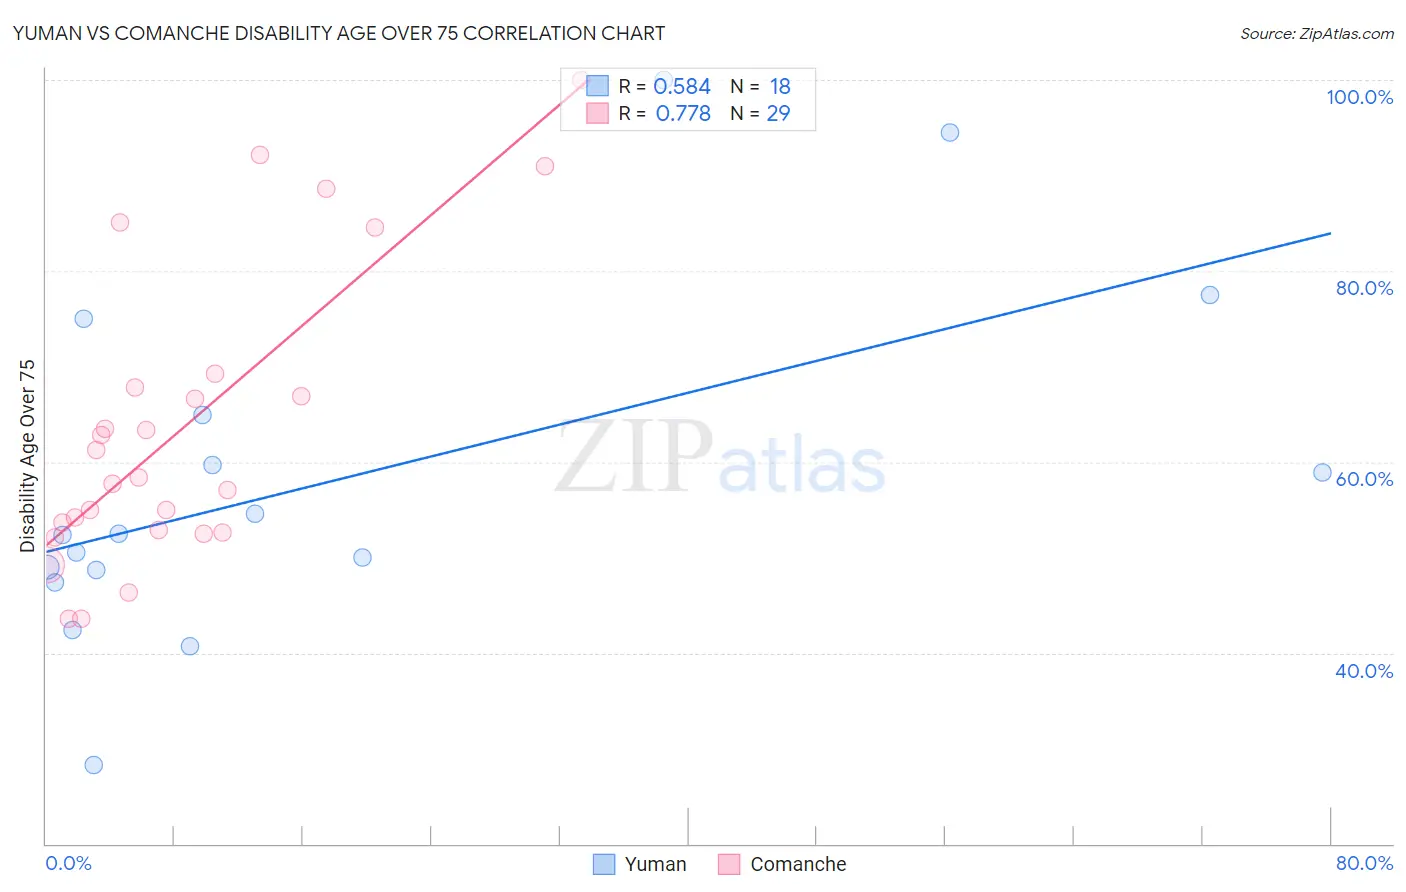
Yuman vs Comanche Disability Age Over 75 Correlation Chart
The statistical analysis conducted on geographies consisting of 40,592,245 people shows a substantial positive correlation between the proportion of Yuman and percentage of population with a disability over the age of 75 in the United States with a correlation coefficient (R) of 0.584 and weighted average of 54.4%. Similarly, the statistical analysis conducted on geographies consisting of 109,684,350 people shows a strong positive correlation between the proportion of Comanche and percentage of population with a disability over the age of 75 in the United States with a correlation coefficient (R) of 0.778 and weighted average of 51.7%, a difference of 5.2%.
Disability Age Over 75 Correlation Summary
| Measurement | Yuman | Comanche |
| Minimum | 28.2% | 43.6% |
| Maximum | 100.0% | 100.0% |
| Range | 71.8% | 56.4% |
| Mean | 58.1% | 63.7% |
| Median | 52.4% | 58.4% |
| Interquartile 25% (IQ1) | 48.7% | 52.7% |
| Interquartile 75% (IQ3) | 64.9% | 68.5% |
| Interquartile Range (IQR) | 16.3% | 15.8% |
| Standard Deviation (Sample) | 18.3% | 15.5% |
| Standard Deviation (Population) | 17.8% | 15.2% |
Demographics Similar to Yuman and Comanche by Disability Age Over 75
In terms of disability age over 75, the demographic groups most similar to Yuman are Immigrants from Armenia (54.3%, a difference of 0.16%), Kiowa (54.2%, a difference of 0.33%), Alaskan Athabascan (54.0%, a difference of 0.85%), Apache (53.6%, a difference of 1.5%), and Colville (55.4%, a difference of 1.8%). Similarly, the demographic groups most similar to Comanche are Paiute (51.5%, a difference of 0.34%), Dutch West Indian (51.5%, a difference of 0.34%), Creek (51.5%, a difference of 0.48%), Immigrants from Yemen (52.0%, a difference of 0.52%), and Menominee (52.3%, a difference of 1.1%).
| Demographics | Rating | Rank | Disability Age Over 75 |
| Creek | 0.0 /100 | #319 | Tragic 51.5% |
| Paiute | 0.0 /100 | #320 | Tragic 51.5% |
| Dutch West Indians | 0.0 /100 | #321 | Tragic 51.5% |
| Comanche | 0.0 /100 | #322 | Tragic 51.7% |
| Immigrants | Yemen | 0.0 /100 | #323 | Tragic 52.0% |
| Menominee | 0.0 /100 | #324 | Tragic 52.3% |
| Immigrants | Cabo Verde | 0.0 /100 | #325 | Tragic 52.4% |
| Ute | 0.0 /100 | #326 | Tragic 52.6% |
| Nepalese | 0.0 /100 | #327 | Tragic 52.6% |
| Choctaw | 0.0 /100 | #328 | Tragic 52.7% |
| Alaska Natives | 0.0 /100 | #329 | Tragic 52.8% |
| Puerto Ricans | 0.0 /100 | #330 | Tragic 52.9% |
| Hopi | 0.0 /100 | #331 | Tragic 52.9% |
| Natives/Alaskans | 0.0 /100 | #332 | Tragic 53.1% |
| Apache | 0.0 /100 | #333 | Tragic 53.6% |
| Alaskan Athabascans | 0.0 /100 | #334 | Tragic 54.0% |
| Kiowa | 0.0 /100 | #335 | Tragic 54.2% |
| Immigrants | Armenia | 0.0 /100 | #336 | Tragic 54.3% |
| Yuman | 0.0 /100 | #337 | Tragic 54.4% |
| Colville | 0.0 /100 | #338 | Tragic 55.4% |
| Pima | 0.0 /100 | #339 | Tragic 55.8% |