Native/Alaskan vs Comanche Nursery School
COMPARE
Native/Alaskan
Comanche
Nursery School
Nursery School Comparison
Natives/Alaskans
Comanche
98.0%
NURSERY SCHOOL
48.6/ 100
METRIC RATING
178th/ 347
METRIC RANK
98.0%
NURSERY SCHOOL
66.0/ 100
METRIC RATING
157th/ 347
METRIC RANK
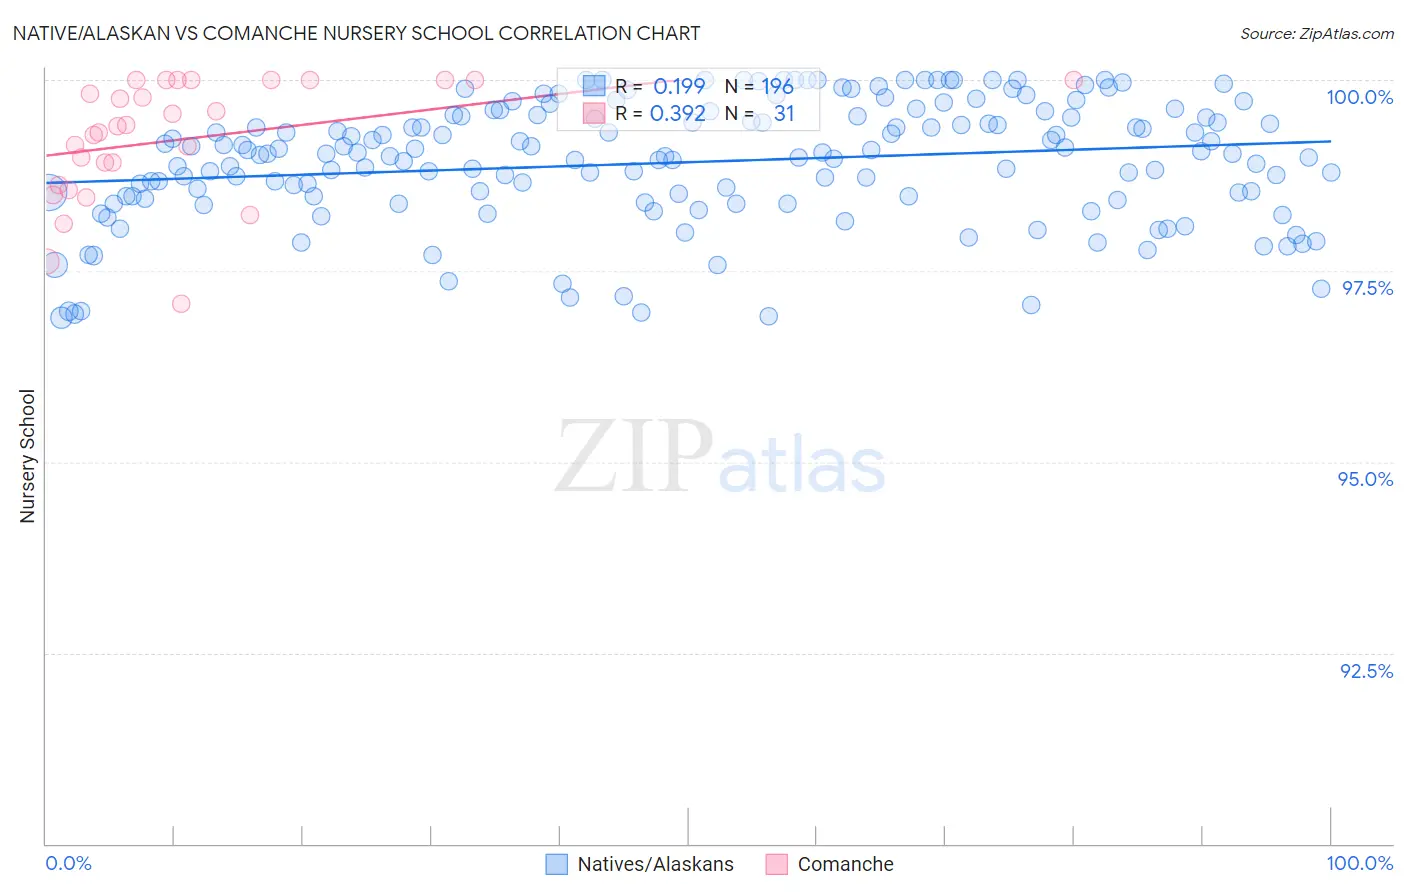
Native/Alaskan vs Comanche Nursery School Correlation Chart
The statistical analysis conducted on geographies consisting of 513,036,548 people shows a poor positive correlation between the proportion of Natives/Alaskans and percentage of population with at least nursery school education in the United States with a correlation coefficient (R) of 0.199 and weighted average of 98.0%. Similarly, the statistical analysis conducted on geographies consisting of 109,786,530 people shows a mild positive correlation between the proportion of Comanche and percentage of population with at least nursery school education in the United States with a correlation coefficient (R) of 0.392 and weighted average of 98.0%, a difference of 0.050%.
Nursery School Correlation Summary
| Measurement | Native/Alaskan | Comanche |
| Minimum | 96.9% | 97.1% |
| Maximum | 100.0% | 100.0% |
| Range | 3.1% | 2.9% |
| Mean | 98.9% | 99.2% |
| Median | 99.0% | 99.4% |
| Interquartile 25% (IQ1) | 98.5% | 98.6% |
| Interquartile 75% (IQ3) | 99.5% | 100.0% |
| Interquartile Range (IQR) | 1.1% | 1.4% |
| Standard Deviation (Sample) | 0.79% | 0.78% |
| Standard Deviation (Population) | 0.79% | 0.77% |
Similar Demographics by Nursery School
Demographics Similar to Natives/Alaskans by Nursery School
In terms of nursery school, the demographic groups most similar to Natives/Alaskans are Kenyan (98.0%, a difference of 0.0%), Navajo (98.0%, a difference of 0.0%), Immigrants from Sri Lanka (98.0%, a difference of 0.0%), Immigrants from Venezuela (98.0%, a difference of 0.0%), and Albanian (98.0%, a difference of 0.0%).
| Demographics | Rating | Rank | Nursery School |
| Immigrants | Jordan | 53.4 /100 | #171 | Average 98.0% |
| Immigrants | Brazil | 51.3 /100 | #172 | Average 98.0% |
| Kenyans | 50.2 /100 | #173 | Average 98.0% |
| Navajo | 50.0 /100 | #174 | Average 98.0% |
| Immigrants | Sri Lanka | 49.9 /100 | #175 | Average 98.0% |
| Immigrants | Venezuela | 49.8 /100 | #176 | Average 98.0% |
| Albanians | 48.9 /100 | #177 | Average 98.0% |
| Natives/Alaskans | 48.6 /100 | #178 | Average 98.0% |
| Argentineans | 46.8 /100 | #179 | Average 98.0% |
| Immigrants | Bosnia and Herzegovina | 45.6 /100 | #180 | Average 98.0% |
| Egyptians | 42.8 /100 | #181 | Average 98.0% |
| Paiute | 42.0 /100 | #182 | Average 98.0% |
| Portuguese | 41.8 /100 | #183 | Average 98.0% |
| Immigrants | Poland | 41.3 /100 | #184 | Average 98.0% |
| Immigrants | Belarus | 41.0 /100 | #185 | Average 98.0% |
Demographics Similar to Comanche by Nursery School
In terms of nursery school, the demographic groups most similar to Comanche are Immigrants from South Central Asia (98.0%, a difference of 0.0%), Venezuelan (98.0%, a difference of 0.0%), Immigrants from North Macedonia (98.0%, a difference of 0.0%), Dutch West Indian (98.0%, a difference of 0.010%), and Immigrants from Moldova (98.0%, a difference of 0.010%).
| Demographics | Rating | Rank | Nursery School |
| Jordanians | 72.9 /100 | #150 | Good 98.1% |
| Soviet Union | 71.6 /100 | #151 | Good 98.0% |
| Dutch West Indians | 70.2 /100 | #152 | Good 98.0% |
| Immigrants | Moldova | 69.6 /100 | #153 | Good 98.0% |
| Immigrants | Iran | 68.7 /100 | #154 | Good 98.0% |
| Immigrants | South Central Asia | 66.7 /100 | #155 | Good 98.0% |
| Venezuelans | 66.6 /100 | #156 | Good 98.0% |
| Comanche | 66.0 /100 | #157 | Good 98.0% |
| Immigrants | North Macedonia | 65.7 /100 | #158 | Good 98.0% |
| French American Indians | 62.1 /100 | #159 | Good 98.0% |
| Immigrants | Russia | 59.9 /100 | #160 | Average 98.0% |
| Immigrants | Eastern Europe | 59.7 /100 | #161 | Average 98.0% |
| Brazilians | 59.4 /100 | #162 | Average 98.0% |
| Immigrants | Italy | 59.0 /100 | #163 | Average 98.0% |
| Ugandans | 56.4 /100 | #164 | Average 98.0% |