Yuman vs Palestinian No Schooling Completed
COMPARE
Yuman
Palestinian
No Schooling Completed
No Schooling Completed Comparison
Yuman
Palestinians
2.5%
NO SCHOOLING COMPLETED
0.4/ 100
METRIC RATING
267th/ 347
METRIC RANK
1.9%
NO SCHOOLING COMPLETED
91.8/ 100
METRIC RATING
130th/ 347
METRIC RANK
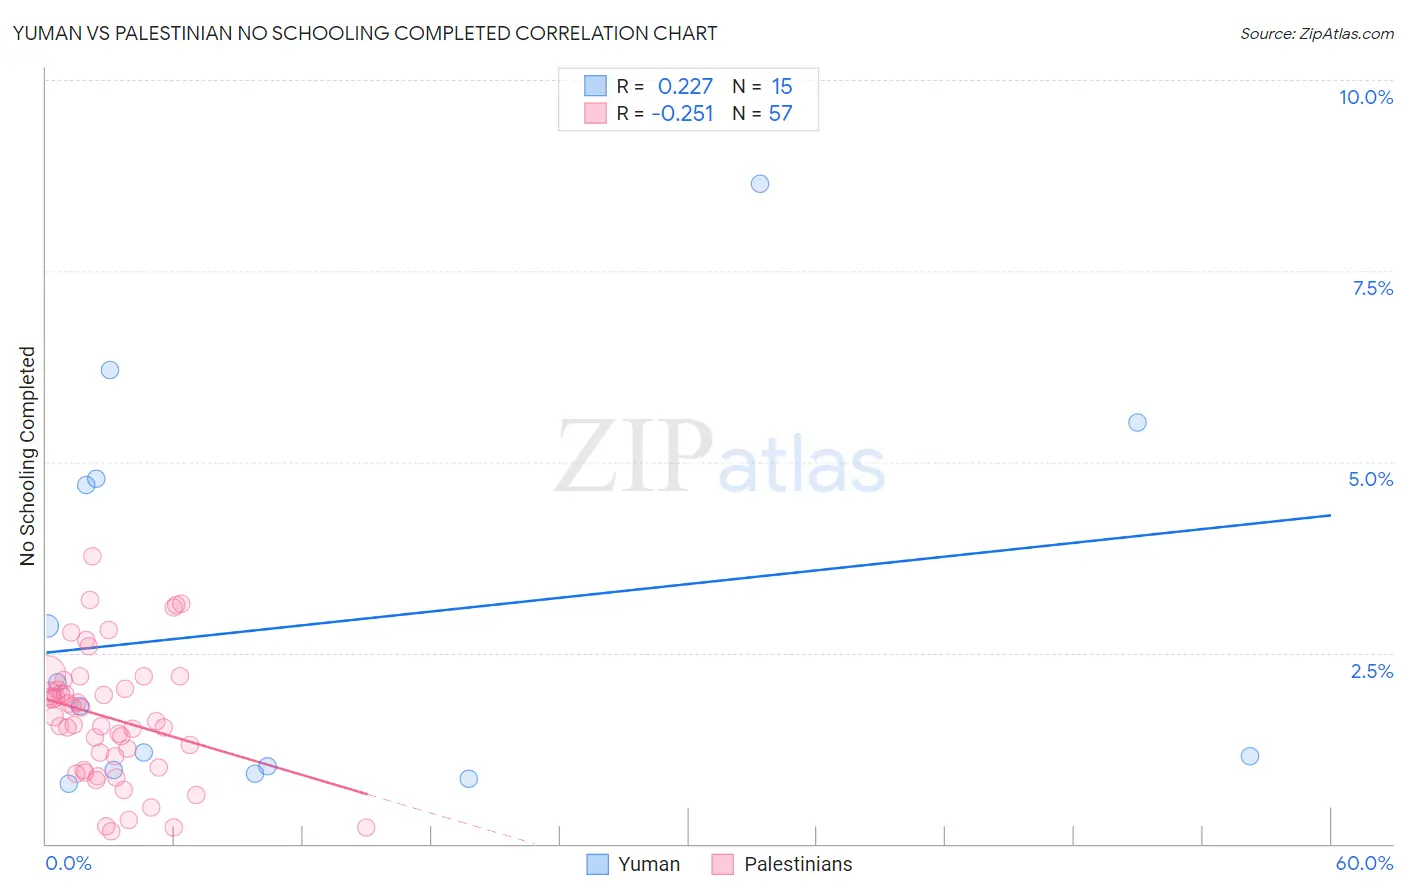
Yuman vs Palestinian No Schooling Completed Correlation Chart
The statistical analysis conducted on geographies consisting of 40,618,798 people shows a weak positive correlation between the proportion of Yuman and percentage of population with no schooling in the United States with a correlation coefficient (R) of 0.227 and weighted average of 2.5%. Similarly, the statistical analysis conducted on geographies consisting of 215,613,106 people shows a weak negative correlation between the proportion of Palestinians and percentage of population with no schooling in the United States with a correlation coefficient (R) of -0.251 and weighted average of 1.9%, a difference of 29.3%.
No Schooling Completed Correlation Summary
| Measurement | Yuman | Palestinian |
| Minimum | 0.78% | 0.16% |
| Maximum | 8.6% | 3.8% |
| Range | 7.9% | 3.6% |
| Mean | 2.9% | 1.6% |
| Median | 1.8% | 1.6% |
| Interquartile 25% (IQ1) | 0.96% | 0.98% |
| Interquartile 75% (IQ3) | 4.8% | 2.1% |
| Interquartile Range (IQR) | 3.8% | 1.1% |
| Standard Deviation (Sample) | 2.5% | 0.83% |
| Standard Deviation (Population) | 2.4% | 0.82% |
Similar Demographics by No Schooling Completed
Demographics Similar to Yuman by No Schooling Completed
In terms of no schooling completed, the demographic groups most similar to Yuman are Fijian (2.5%, a difference of 0.17%), West Indian (2.5%, a difference of 0.25%), Taiwanese (2.5%, a difference of 0.26%), Indian (Asian) (2.5%, a difference of 0.43%), and Immigrants from Liberia (2.5%, a difference of 0.56%).
| Demographics | Rating | Rank | No Schooling Completed |
| Immigrants | Ethiopia | 0.6 /100 | #260 | Tragic 2.5% |
| Armenians | 0.5 /100 | #261 | Tragic 2.5% |
| Immigrants | Sierra Leone | 0.5 /100 | #262 | Tragic 2.5% |
| Immigrants | Liberia | 0.4 /100 | #263 | Tragic 2.5% |
| Indians (Asian) | 0.4 /100 | #264 | Tragic 2.5% |
| West Indians | 0.4 /100 | #265 | Tragic 2.5% |
| Fijians | 0.4 /100 | #266 | Tragic 2.5% |
| Yuman | 0.4 /100 | #267 | Tragic 2.5% |
| Taiwanese | 0.3 /100 | #268 | Tragic 2.5% |
| Immigrants | Nigeria | 0.2 /100 | #269 | Tragic 2.5% |
| Immigrants | Peru | 0.2 /100 | #270 | Tragic 2.5% |
| Cubans | 0.2 /100 | #271 | Tragic 2.5% |
| Immigrants | Bolivia | 0.2 /100 | #272 | Tragic 2.5% |
| Immigrants | Cameroon | 0.1 /100 | #273 | Tragic 2.5% |
| Ghanaians | 0.1 /100 | #274 | Tragic 2.6% |
Demographics Similar to Palestinians by No Schooling Completed
In terms of no schooling completed, the demographic groups most similar to Palestinians are Seminole (1.9%, a difference of 0.11%), Immigrants from Hungary (1.9%, a difference of 0.11%), Spaniard (1.9%, a difference of 0.25%), Israeli (1.9%, a difference of 0.33%), and Immigrants from Romania (1.9%, a difference of 0.40%).
| Demographics | Rating | Rank | No Schooling Completed |
| Immigrants | Kuwait | 93.9 /100 | #123 | Exceptional 1.9% |
| Cambodians | 93.8 /100 | #124 | Exceptional 1.9% |
| Immigrants | Europe | 93.7 /100 | #125 | Exceptional 1.9% |
| Immigrants | Romania | 92.6 /100 | #126 | Exceptional 1.9% |
| Israelis | 92.4 /100 | #127 | Exceptional 1.9% |
| Spaniards | 92.3 /100 | #128 | Exceptional 1.9% |
| Seminole | 92.0 /100 | #129 | Exceptional 1.9% |
| Palestinians | 91.8 /100 | #130 | Exceptional 1.9% |
| Immigrants | Hungary | 91.6 /100 | #131 | Exceptional 1.9% |
| Colville | 90.4 /100 | #132 | Exceptional 1.9% |
| Immigrants | Turkey | 90.2 /100 | #133 | Exceptional 1.9% |
| Menominee | 89.6 /100 | #134 | Excellent 1.9% |
| Hmong | 88.5 /100 | #135 | Excellent 1.9% |
| Burmese | 88.2 /100 | #136 | Excellent 1.9% |
| Filipinos | 85.5 /100 | #137 | Excellent 2.0% |