Yuman vs Immigrants from Cambodia No Schooling Completed
COMPARE
Yuman
Immigrants from Cambodia
No Schooling Completed
No Schooling Completed Comparison
Yuman
Immigrants from Cambodia
2.5%
NO SCHOOLING COMPLETED
0.4/ 100
METRIC RATING
267th/ 347
METRIC RANK
3.5%
NO SCHOOLING COMPLETED
0.0/ 100
METRIC RATING
335th/ 347
METRIC RANK
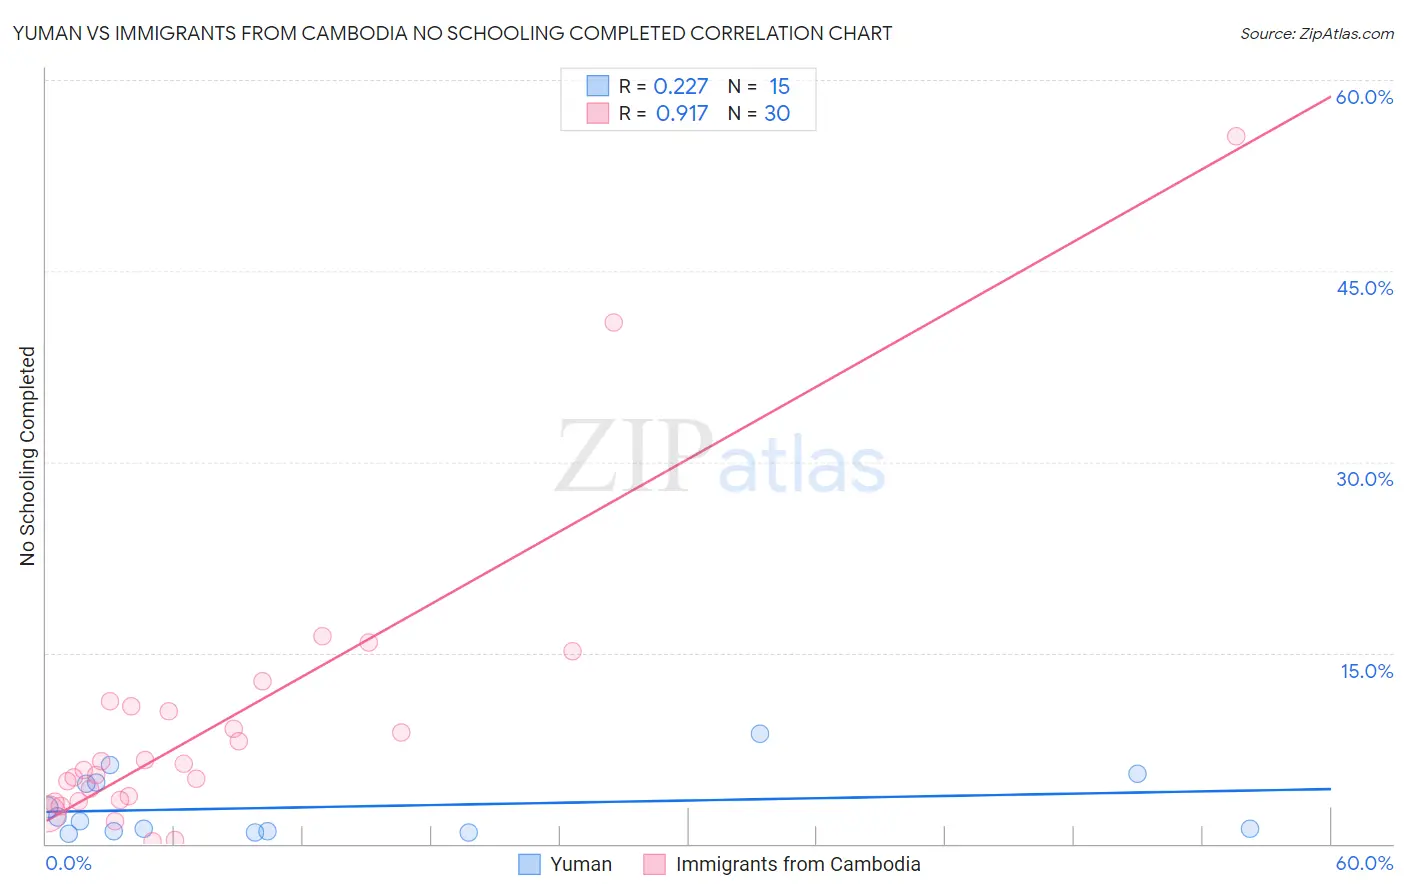
Yuman vs Immigrants from Cambodia No Schooling Completed Correlation Chart
The statistical analysis conducted on geographies consisting of 40,618,798 people shows a weak positive correlation between the proportion of Yuman and percentage of population with no schooling in the United States with a correlation coefficient (R) of 0.227 and weighted average of 2.5%. Similarly, the statistical analysis conducted on geographies consisting of 204,723,315 people shows a near-perfect positive correlation between the proportion of Immigrants from Cambodia and percentage of population with no schooling in the United States with a correlation coefficient (R) of 0.917 and weighted average of 3.5%, a difference of 40.7%.
No Schooling Completed Correlation Summary
| Measurement | Yuman | Immigrants from Cambodia |
| Minimum | 0.78% | 0.15% |
| Maximum | 8.6% | 55.6% |
| Range | 7.9% | 55.4% |
| Mean | 2.9% | 9.5% |
| Median | 1.8% | 6.0% |
| Interquartile 25% (IQ1) | 0.96% | 3.4% |
| Interquartile 75% (IQ3) | 4.8% | 10.8% |
| Interquartile Range (IQR) | 3.8% | 7.4% |
| Standard Deviation (Sample) | 2.5% | 11.5% |
| Standard Deviation (Population) | 2.4% | 11.4% |
Similar Demographics by No Schooling Completed
Demographics Similar to Yuman by No Schooling Completed
In terms of no schooling completed, the demographic groups most similar to Yuman are Fijian (2.5%, a difference of 0.17%), West Indian (2.5%, a difference of 0.25%), Taiwanese (2.5%, a difference of 0.26%), Indian (Asian) (2.5%, a difference of 0.43%), and Immigrants from Liberia (2.5%, a difference of 0.56%).
| Demographics | Rating | Rank | No Schooling Completed |
| Immigrants | Ethiopia | 0.6 /100 | #260 | Tragic 2.5% |
| Armenians | 0.5 /100 | #261 | Tragic 2.5% |
| Immigrants | Sierra Leone | 0.5 /100 | #262 | Tragic 2.5% |
| Immigrants | Liberia | 0.4 /100 | #263 | Tragic 2.5% |
| Indians (Asian) | 0.4 /100 | #264 | Tragic 2.5% |
| West Indians | 0.4 /100 | #265 | Tragic 2.5% |
| Fijians | 0.4 /100 | #266 | Tragic 2.5% |
| Yuman | 0.4 /100 | #267 | Tragic 2.5% |
| Taiwanese | 0.3 /100 | #268 | Tragic 2.5% |
| Immigrants | Nigeria | 0.2 /100 | #269 | Tragic 2.5% |
| Immigrants | Peru | 0.2 /100 | #270 | Tragic 2.5% |
| Cubans | 0.2 /100 | #271 | Tragic 2.5% |
| Immigrants | Bolivia | 0.2 /100 | #272 | Tragic 2.5% |
| Immigrants | Cameroon | 0.1 /100 | #273 | Tragic 2.5% |
| Ghanaians | 0.1 /100 | #274 | Tragic 2.6% |
Demographics Similar to Immigrants from Cambodia by No Schooling Completed
In terms of no schooling completed, the demographic groups most similar to Immigrants from Cambodia are Immigrants from Fiji (3.5%, a difference of 0.37%), Guatemalan (3.5%, a difference of 1.0%), Immigrants from Cabo Verde (3.5%, a difference of 1.1%), Bangladeshi (3.5%, a difference of 1.3%), and Yakama (3.6%, a difference of 1.6%).
| Demographics | Rating | Rank | No Schooling Completed |
| Mexicans | 0.0 /100 | #328 | Tragic 3.3% |
| Immigrants | Vietnam | 0.0 /100 | #329 | Tragic 3.3% |
| Immigrants | Armenia | 0.0 /100 | #330 | Tragic 3.3% |
| Japanese | 0.0 /100 | #331 | Tragic 3.3% |
| Central Americans | 0.0 /100 | #332 | Tragic 3.4% |
| Immigrants | Dominican Republic | 0.0 /100 | #333 | Tragic 3.4% |
| Guatemalans | 0.0 /100 | #334 | Tragic 3.5% |
| Immigrants | Cambodia | 0.0 /100 | #335 | Tragic 3.5% |
| Immigrants | Fiji | 0.0 /100 | #336 | Tragic 3.5% |
| Immigrants | Cabo Verde | 0.0 /100 | #337 | Tragic 3.5% |
| Bangladeshis | 0.0 /100 | #338 | Tragic 3.5% |
| Yakama | 0.0 /100 | #339 | Tragic 3.6% |
| Immigrants | Guatemala | 0.0 /100 | #340 | Tragic 3.6% |
| Immigrants | Central America | 0.0 /100 | #341 | Tragic 3.6% |
| Immigrants | Mexico | 0.0 /100 | #342 | Tragic 3.6% |