Yuman vs Spanish No Schooling Completed
COMPARE
Yuman
Spanish
No Schooling Completed
No Schooling Completed Comparison
Yuman
Spanish
2.5%
NO SCHOOLING COMPLETED
0.4/ 100
METRIC RATING
267th/ 347
METRIC RANK
1.9%
NO SCHOOLING COMPLETED
95.5/ 100
METRIC RATING
118th/ 347
METRIC RANK
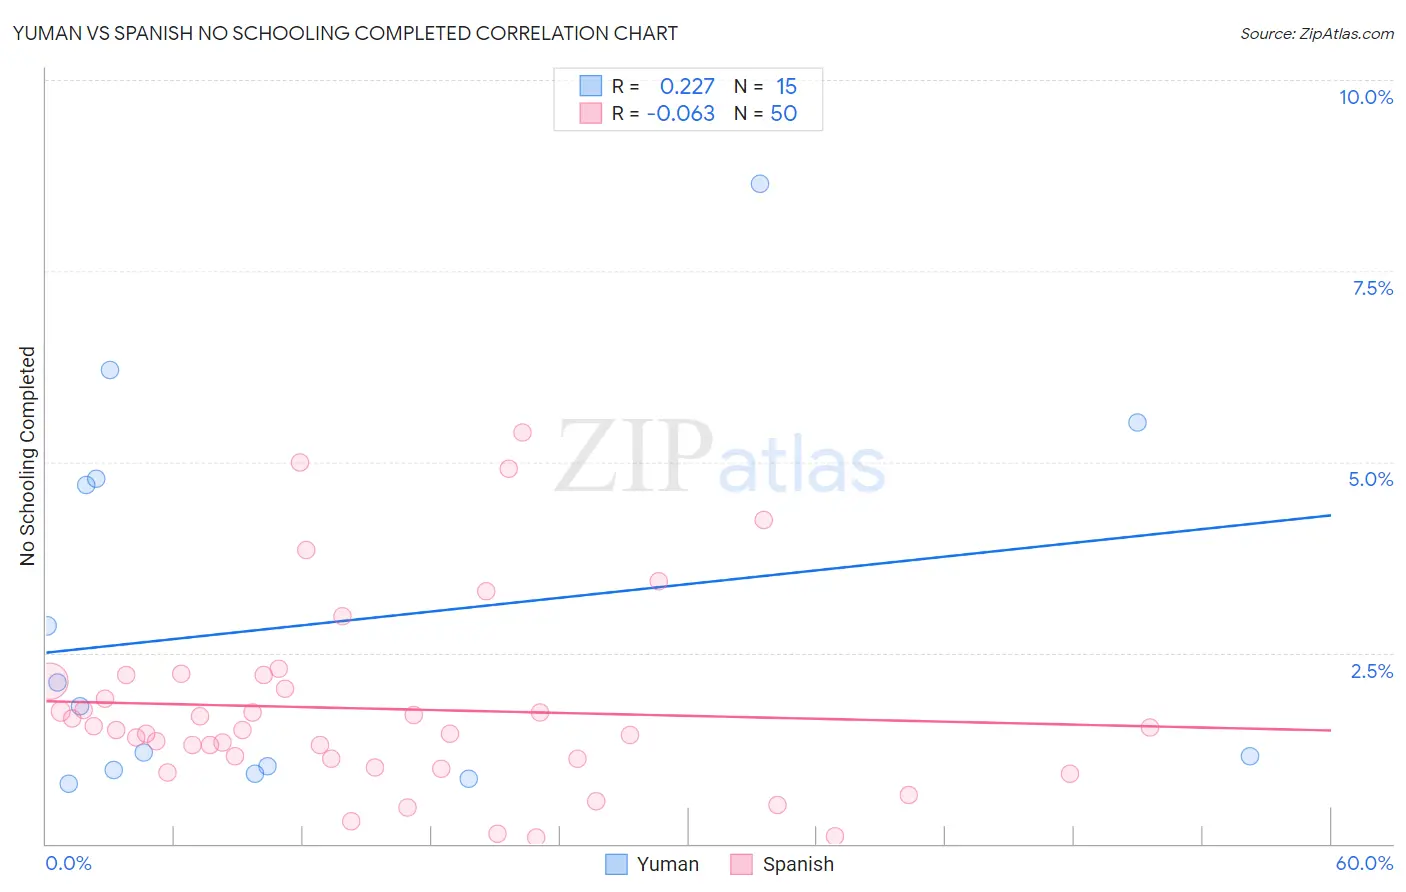
Yuman vs Spanish No Schooling Completed Correlation Chart
The statistical analysis conducted on geographies consisting of 40,618,798 people shows a weak positive correlation between the proportion of Yuman and percentage of population with no schooling in the United States with a correlation coefficient (R) of 0.227 and weighted average of 2.5%. Similarly, the statistical analysis conducted on geographies consisting of 416,846,352 people shows a slight negative correlation between the proportion of Spanish and percentage of population with no schooling in the United States with a correlation coefficient (R) of -0.063 and weighted average of 1.9%, a difference of 32.5%.
No Schooling Completed Correlation Summary
| Measurement | Yuman | Spanish |
| Minimum | 0.78% | 0.088% |
| Maximum | 8.6% | 5.4% |
| Range | 7.9% | 5.3% |
| Mean | 2.9% | 1.8% |
| Median | 1.8% | 1.5% |
| Interquartile 25% (IQ1) | 0.96% | 1.1% |
| Interquartile 75% (IQ3) | 4.8% | 2.1% |
| Interquartile Range (IQR) | 3.8% | 1.0% |
| Standard Deviation (Sample) | 2.5% | 1.2% |
| Standard Deviation (Population) | 2.4% | 1.2% |
Similar Demographics by No Schooling Completed
Demographics Similar to Yuman by No Schooling Completed
In terms of no schooling completed, the demographic groups most similar to Yuman are Fijian (2.5%, a difference of 0.17%), West Indian (2.5%, a difference of 0.25%), Taiwanese (2.5%, a difference of 0.26%), Indian (Asian) (2.5%, a difference of 0.43%), and Immigrants from Liberia (2.5%, a difference of 0.56%).
| Demographics | Rating | Rank | No Schooling Completed |
| Immigrants | Ethiopia | 0.6 /100 | #260 | Tragic 2.5% |
| Armenians | 0.5 /100 | #261 | Tragic 2.5% |
| Immigrants | Sierra Leone | 0.5 /100 | #262 | Tragic 2.5% |
| Immigrants | Liberia | 0.4 /100 | #263 | Tragic 2.5% |
| Indians (Asian) | 0.4 /100 | #264 | Tragic 2.5% |
| West Indians | 0.4 /100 | #265 | Tragic 2.5% |
| Fijians | 0.4 /100 | #266 | Tragic 2.5% |
| Yuman | 0.4 /100 | #267 | Tragic 2.5% |
| Taiwanese | 0.3 /100 | #268 | Tragic 2.5% |
| Immigrants | Nigeria | 0.2 /100 | #269 | Tragic 2.5% |
| Immigrants | Peru | 0.2 /100 | #270 | Tragic 2.5% |
| Cubans | 0.2 /100 | #271 | Tragic 2.5% |
| Immigrants | Bolivia | 0.2 /100 | #272 | Tragic 2.5% |
| Immigrants | Cameroon | 0.1 /100 | #273 | Tragic 2.5% |
| Ghanaians | 0.1 /100 | #274 | Tragic 2.6% |
Demographics Similar to Spanish by No Schooling Completed
In terms of no schooling completed, the demographic groups most similar to Spanish are Immigrants from Serbia (1.9%, a difference of 0.24%), Iroquois (1.9%, a difference of 0.35%), Lebanese (1.9%, a difference of 0.44%), Syrian (1.9%, a difference of 0.46%), and Immigrants from Norway (1.9%, a difference of 0.59%).
| Demographics | Rating | Rank | No Schooling Completed |
| Immigrants | Japan | 96.6 /100 | #111 | Exceptional 1.9% |
| Pueblo | 96.4 /100 | #112 | Exceptional 1.9% |
| Immigrants | Zimbabwe | 96.2 /100 | #113 | Exceptional 1.9% |
| Immigrants | Norway | 96.1 /100 | #114 | Exceptional 1.9% |
| Syrians | 96.0 /100 | #115 | Exceptional 1.9% |
| Lebanese | 96.0 /100 | #116 | Exceptional 1.9% |
| Immigrants | Serbia | 95.8 /100 | #117 | Exceptional 1.9% |
| Spanish | 95.5 /100 | #118 | Exceptional 1.9% |
| Iroquois | 95.1 /100 | #119 | Exceptional 1.9% |
| Immigrants | Bulgaria | 94.6 /100 | #120 | Exceptional 1.9% |
| Immigrants | Croatia | 94.5 /100 | #121 | Exceptional 1.9% |
| Cree | 94.5 /100 | #122 | Exceptional 1.9% |
| Immigrants | Kuwait | 93.9 /100 | #123 | Exceptional 1.9% |
| Cambodians | 93.8 /100 | #124 | Exceptional 1.9% |
| Immigrants | Europe | 93.7 /100 | #125 | Exceptional 1.9% |