Yuman vs South American No Schooling Completed
COMPARE
Yuman
South American
No Schooling Completed
No Schooling Completed Comparison
Yuman
South Americans
2.5%
NO SCHOOLING COMPLETED
0.4/ 100
METRIC RATING
267th/ 347
METRIC RANK
2.4%
NO SCHOOLING COMPLETED
1.5/ 100
METRIC RATING
243rd/ 347
METRIC RANK
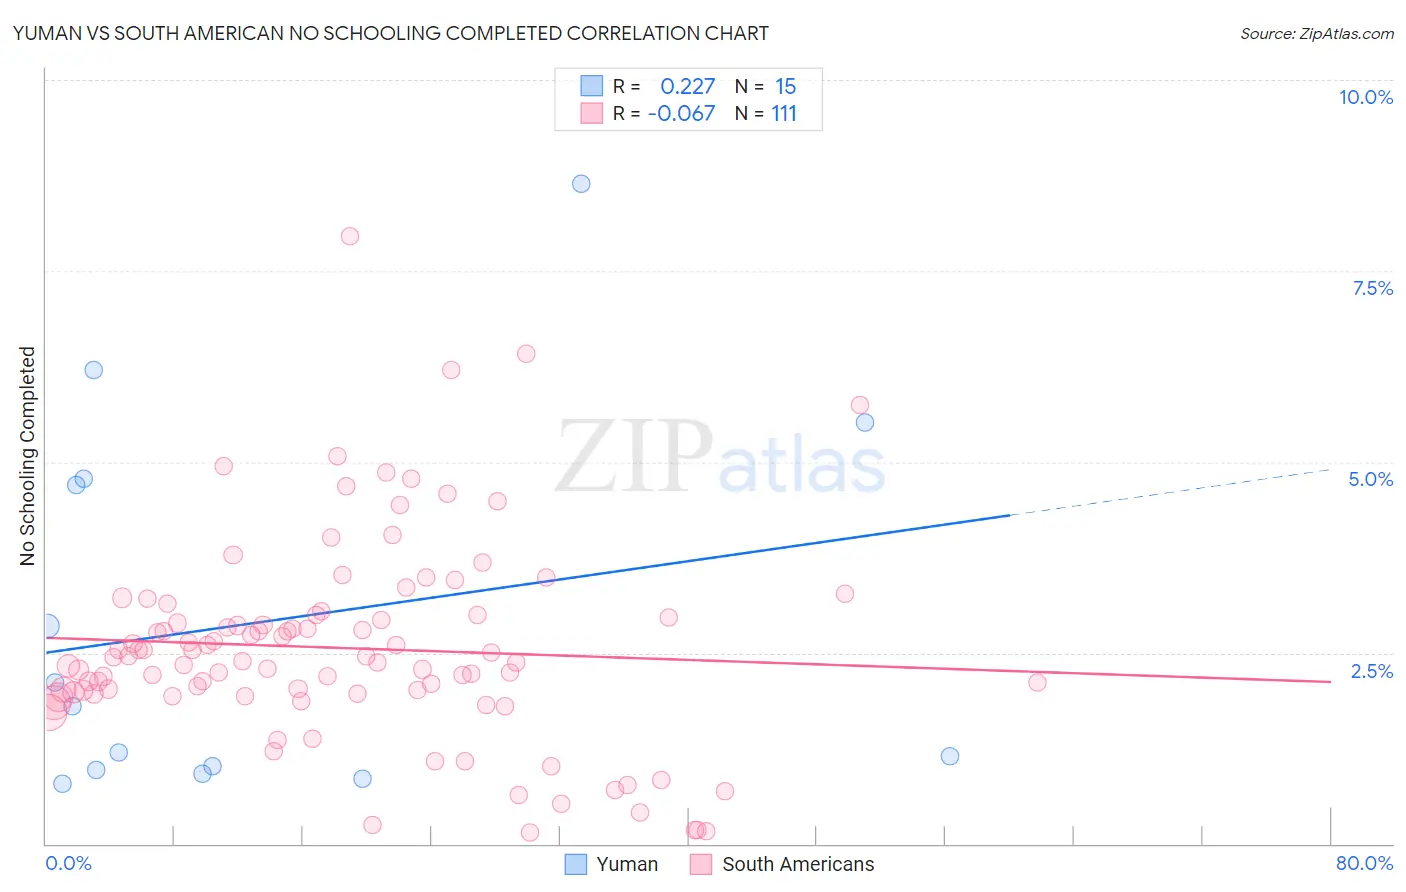
Yuman vs South American No Schooling Completed Correlation Chart
The statistical analysis conducted on geographies consisting of 40,618,798 people shows a weak positive correlation between the proportion of Yuman and percentage of population with no schooling in the United States with a correlation coefficient (R) of 0.227 and weighted average of 2.5%. Similarly, the statistical analysis conducted on geographies consisting of 486,388,678 people shows a slight negative correlation between the proportion of South Americans and percentage of population with no schooling in the United States with a correlation coefficient (R) of -0.067 and weighted average of 2.4%, a difference of 4.1%.
No Schooling Completed Correlation Summary
| Measurement | Yuman | South American |
| Minimum | 0.78% | 0.14% |
| Maximum | 8.6% | 7.9% |
| Range | 7.9% | 7.8% |
| Mean | 2.9% | 2.6% |
| Median | 1.8% | 2.4% |
| Interquartile 25% (IQ1) | 0.96% | 2.0% |
| Interquartile 75% (IQ3) | 4.8% | 3.0% |
| Interquartile Range (IQR) | 3.8% | 1.0% |
| Standard Deviation (Sample) | 2.5% | 1.3% |
| Standard Deviation (Population) | 2.4% | 1.3% |
Similar Demographics by No Schooling Completed
Demographics Similar to Yuman by No Schooling Completed
In terms of no schooling completed, the demographic groups most similar to Yuman are Fijian (2.5%, a difference of 0.17%), West Indian (2.5%, a difference of 0.25%), Taiwanese (2.5%, a difference of 0.26%), Indian (Asian) (2.5%, a difference of 0.43%), and Immigrants from Liberia (2.5%, a difference of 0.56%).
| Demographics | Rating | Rank | No Schooling Completed |
| Immigrants | Ethiopia | 0.6 /100 | #260 | Tragic 2.5% |
| Armenians | 0.5 /100 | #261 | Tragic 2.5% |
| Immigrants | Sierra Leone | 0.5 /100 | #262 | Tragic 2.5% |
| Immigrants | Liberia | 0.4 /100 | #263 | Tragic 2.5% |
| Indians (Asian) | 0.4 /100 | #264 | Tragic 2.5% |
| West Indians | 0.4 /100 | #265 | Tragic 2.5% |
| Fijians | 0.4 /100 | #266 | Tragic 2.5% |
| Yuman | 0.4 /100 | #267 | Tragic 2.5% |
| Taiwanese | 0.3 /100 | #268 | Tragic 2.5% |
| Immigrants | Nigeria | 0.2 /100 | #269 | Tragic 2.5% |
| Immigrants | Peru | 0.2 /100 | #270 | Tragic 2.5% |
| Cubans | 0.2 /100 | #271 | Tragic 2.5% |
| Immigrants | Bolivia | 0.2 /100 | #272 | Tragic 2.5% |
| Immigrants | Cameroon | 0.1 /100 | #273 | Tragic 2.5% |
| Ghanaians | 0.1 /100 | #274 | Tragic 2.6% |
Demographics Similar to South Americans by No Schooling Completed
In terms of no schooling completed, the demographic groups most similar to South Americans are Immigrants from Indonesia (2.4%, a difference of 0.040%), Peruvian (2.4%, a difference of 0.11%), Bolivian (2.4%, a difference of 0.11%), Immigrants from Congo (2.4%, a difference of 0.16%), and Immigrants from Iraq (2.4%, a difference of 0.27%).
| Demographics | Rating | Rank | No Schooling Completed |
| Iraqis | 2.2 /100 | #236 | Tragic 2.4% |
| Immigrants | Eastern Asia | 2.0 /100 | #237 | Tragic 2.4% |
| Paiute | 1.9 /100 | #238 | Tragic 2.4% |
| Liberians | 1.8 /100 | #239 | Tragic 2.4% |
| Immigrants | Senegal | 1.7 /100 | #240 | Tragic 2.4% |
| Koreans | 1.7 /100 | #241 | Tragic 2.4% |
| Immigrants | Indonesia | 1.5 /100 | #242 | Tragic 2.4% |
| South Americans | 1.5 /100 | #243 | Tragic 2.4% |
| Peruvians | 1.4 /100 | #244 | Tragic 2.4% |
| Bolivians | 1.4 /100 | #245 | Tragic 2.4% |
| Immigrants | Congo | 1.4 /100 | #246 | Tragic 2.4% |
| Immigrants | Iraq | 1.3 /100 | #247 | Tragic 2.4% |
| Asians | 1.2 /100 | #248 | Tragic 2.4% |
| Jamaicans | 1.2 /100 | #249 | Tragic 2.4% |
| Immigrants | Middle Africa | 1.1 /100 | #250 | Tragic 2.4% |