Yugoslavian vs Immigrants from Caribbean College, Under 1 year
COMPARE
Yugoslavian
Immigrants from Caribbean
College, Under 1 year
College, Under 1 year Comparison
Yugoslavians
Immigrants from Caribbean
65.6%
COLLEGE, UNDER 1 YEAR
55.7/ 100
METRIC RATING
169th/ 347
METRIC RANK
56.6%
COLLEGE, UNDER 1 YEAR
0.0/ 100
METRIC RATING
322nd/ 347
METRIC RANK
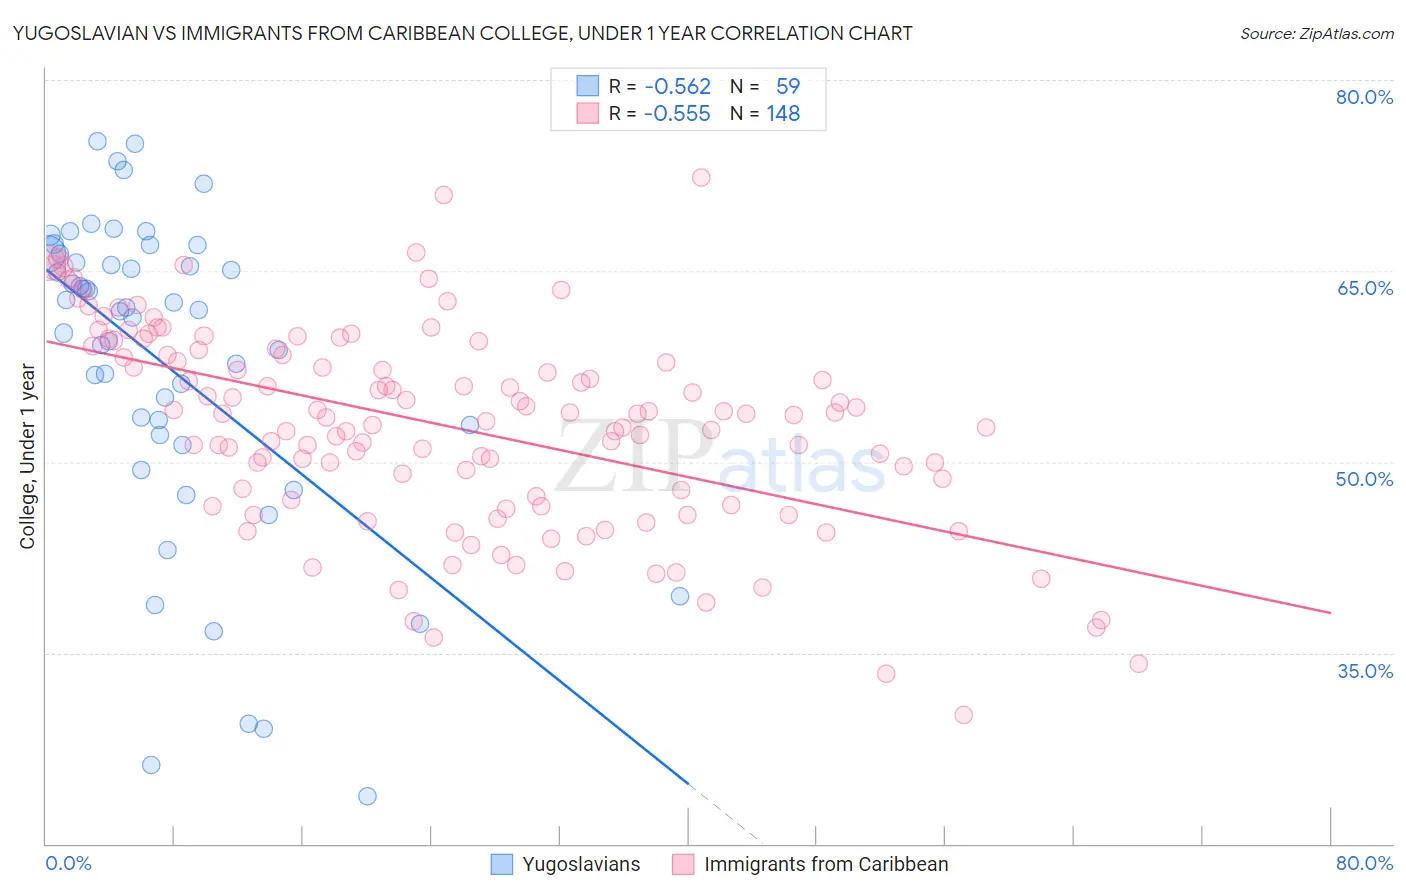
Yugoslavian vs Immigrants from Caribbean College, Under 1 year Correlation Chart
The statistical analysis conducted on geographies consisting of 285,723,201 people shows a substantial negative correlation between the proportion of Yugoslavians and percentage of population with at least college, under 1 year education in the United States with a correlation coefficient (R) of -0.562 and weighted average of 65.6%. Similarly, the statistical analysis conducted on geographies consisting of 450,062,086 people shows a substantial negative correlation between the proportion of Immigrants from Caribbean and percentage of population with at least college, under 1 year education in the United States with a correlation coefficient (R) of -0.555 and weighted average of 56.6%, a difference of 15.9%.
College, Under 1 year Correlation Summary
| Measurement | Yugoslavian | Immigrants from Caribbean |
| Minimum | 23.8% | 30.2% |
| Maximum | 75.2% | 72.4% |
| Range | 51.5% | 42.2% |
| Mean | 57.7% | 52.8% |
| Median | 61.9% | 53.7% |
| Interquartile 25% (IQ1) | 52.1% | 47.1% |
| Interquartile 75% (IQ3) | 66.3% | 58.6% |
| Interquartile Range (IQR) | 14.2% | 11.5% |
| Standard Deviation (Sample) | 12.5% | 7.9% |
| Standard Deviation (Population) | 12.3% | 7.9% |
Similar Demographics by College, Under 1 year
Demographics Similar to Yugoslavians by College, Under 1 year
In terms of college, under 1 year, the demographic groups most similar to Yugoslavians are German (65.6%, a difference of 0.0%), Hungarian (65.6%, a difference of 0.010%), Immigrants from Somalia (65.6%, a difference of 0.030%), Immigrants from Oceania (65.6%, a difference of 0.030%), and Moroccan (65.6%, a difference of 0.040%).
| Demographics | Rating | Rank | College, Under 1 year |
| Koreans | 65.3 /100 | #162 | Good 65.9% |
| Somalis | 62.7 /100 | #163 | Good 65.8% |
| Czechoslovakians | 62.6 /100 | #164 | Good 65.8% |
| Immigrants | Uzbekistan | 61.6 /100 | #165 | Good 65.8% |
| Moroccans | 56.7 /100 | #166 | Average 65.6% |
| Immigrants | Somalia | 56.4 /100 | #167 | Average 65.6% |
| Hungarians | 55.9 /100 | #168 | Average 65.6% |
| Yugoslavians | 55.7 /100 | #169 | Average 65.6% |
| Germans | 55.7 /100 | #170 | Average 65.6% |
| Immigrants | Oceania | 55.0 /100 | #171 | Average 65.6% |
| South American Indians | 54.4 /100 | #172 | Average 65.5% |
| Swiss | 53.9 /100 | #173 | Average 65.5% |
| Immigrants | Bosnia and Herzegovina | 50.0 /100 | #174 | Average 65.4% |
| Scotch-Irish | 49.5 /100 | #175 | Average 65.4% |
| French | 48.9 /100 | #176 | Average 65.4% |
Demographics Similar to Immigrants from Caribbean by College, Under 1 year
In terms of college, under 1 year, the demographic groups most similar to Immigrants from Caribbean are Native/Alaskan (56.6%, a difference of 0.13%), Immigrants from Honduras (56.5%, a difference of 0.18%), Immigrants from El Salvador (56.4%, a difference of 0.31%), Guatemalan (56.8%, a difference of 0.39%), and Immigrants from Latin America (56.3%, a difference of 0.41%).
| Demographics | Rating | Rank | College, Under 1 year |
| Hondurans | 0.0 /100 | #315 | Tragic 57.1% |
| Menominee | 0.0 /100 | #316 | Tragic 57.0% |
| Hispanics or Latinos | 0.0 /100 | #317 | Tragic 57.0% |
| Immigrants | Haiti | 0.0 /100 | #318 | Tragic 56.9% |
| Puerto Ricans | 0.0 /100 | #319 | Tragic 56.8% |
| Guatemalans | 0.0 /100 | #320 | Tragic 56.8% |
| Natives/Alaskans | 0.0 /100 | #321 | Tragic 56.6% |
| Immigrants | Caribbean | 0.0 /100 | #322 | Tragic 56.6% |
| Immigrants | Honduras | 0.0 /100 | #323 | Tragic 56.5% |
| Immigrants | El Salvador | 0.0 /100 | #324 | Tragic 56.4% |
| Immigrants | Latin America | 0.0 /100 | #325 | Tragic 56.3% |
| Navajo | 0.0 /100 | #326 | Tragic 56.3% |
| Immigrants | Guatemala | 0.0 /100 | #327 | Tragic 56.2% |
| Cape Verdeans | 0.0 /100 | #328 | Tragic 56.0% |
| Immigrants | Cuba | 0.0 /100 | #329 | Tragic 55.7% |