Yugoslavian vs Scandinavian Professional Degree
COMPARE
Yugoslavian
Scandinavian
Professional Degree
Professional Degree Comparison
Yugoslavians
Scandinavians
4.1%
PROFESSIONAL DEGREE
13.4/ 100
METRIC RATING
206th/ 347
METRIC RANK
4.2%
PROFESSIONAL DEGREE
25.8/ 100
METRIC RATING
194th/ 347
METRIC RANK
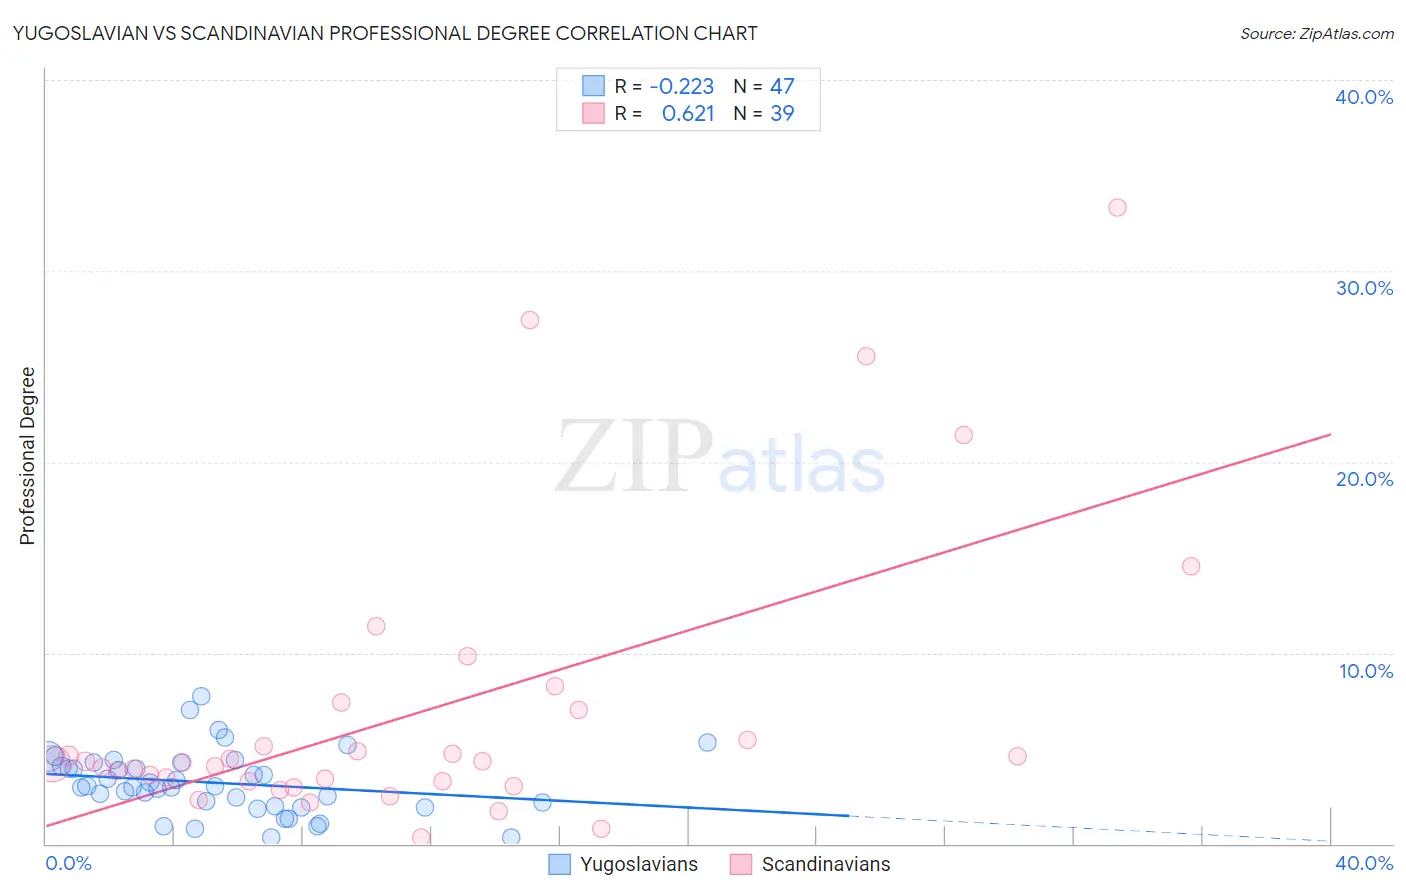
Yugoslavian vs Scandinavian Professional Degree Correlation Chart
The statistical analysis conducted on geographies consisting of 285,276,070 people shows a weak negative correlation between the proportion of Yugoslavians and percentage of population with at least professional degree education in the United States with a correlation coefficient (R) of -0.223 and weighted average of 4.1%. Similarly, the statistical analysis conducted on geographies consisting of 469,840,840 people shows a significant positive correlation between the proportion of Scandinavians and percentage of population with at least professional degree education in the United States with a correlation coefficient (R) of 0.621 and weighted average of 4.2%, a difference of 3.1%.
Professional Degree Correlation Summary
| Measurement | Yugoslavian | Scandinavian |
| Minimum | 0.35% | 0.33% |
| Maximum | 7.7% | 33.3% |
| Range | 7.4% | 33.0% |
| Mean | 3.2% | 6.9% |
| Median | 3.0% | 4.2% |
| Interquartile 25% (IQ1) | 2.0% | 3.3% |
| Interquartile 75% (IQ3) | 4.2% | 7.0% |
| Interquartile Range (IQR) | 2.2% | 3.8% |
| Standard Deviation (Sample) | 1.6% | 7.5% |
| Standard Deviation (Population) | 1.6% | 7.4% |
Demographics Similar to Yugoslavians and Scandinavians by Professional Degree
In terms of professional degree, the demographic groups most similar to Yugoslavians are Subsaharan African (4.1%, a difference of 0.24%), Immigrants from Somalia (4.1%, a difference of 0.32%), Immigrants from Panama (4.1%, a difference of 0.40%), Somali (4.1%, a difference of 0.42%), and Immigrants from Nigeria (4.1%, a difference of 0.62%). Similarly, the demographic groups most similar to Scandinavians are Nigerian (4.2%, a difference of 0.24%), French (4.2%, a difference of 0.25%), Ghanaian (4.3%, a difference of 0.29%), Spanish (4.2%, a difference of 0.57%), and Sri Lankan (4.3%, a difference of 0.62%).
| Demographics | Rating | Rank | Professional Degree |
| Immigrants | Poland | 29.2 /100 | #190 | Fair 4.3% |
| Sri Lankans | 29.0 /100 | #191 | Fair 4.3% |
| Ghanaians | 27.3 /100 | #192 | Fair 4.3% |
| French | 27.1 /100 | #193 | Fair 4.2% |
| Scandinavians | 25.8 /100 | #194 | Fair 4.2% |
| Nigerians | 24.6 /100 | #195 | Fair 4.2% |
| Spanish | 23.0 /100 | #196 | Fair 4.2% |
| Czechoslovakians | 22.4 /100 | #197 | Fair 4.2% |
| Immigrants | Middle Africa | 22.1 /100 | #198 | Fair 4.2% |
| Norwegians | 20.5 /100 | #199 | Fair 4.2% |
| Immigrants | North Macedonia | 20.2 /100 | #200 | Fair 4.2% |
| Finns | 18.7 /100 | #201 | Poor 4.2% |
| Immigrants | Iraq | 17.1 /100 | #202 | Poor 4.2% |
| Panamanians | 15.9 /100 | #203 | Poor 4.1% |
| Barbadians | 15.8 /100 | #204 | Poor 4.1% |
| Somalis | 14.8 /100 | #205 | Poor 4.1% |
| Yugoslavians | 13.4 /100 | #206 | Poor 4.1% |
| Sub-Saharan Africans | 12.8 /100 | #207 | Poor 4.1% |
| Immigrants | Somalia | 12.5 /100 | #208 | Poor 4.1% |
| Immigrants | Panama | 12.3 /100 | #209 | Poor 4.1% |
| Immigrants | Nigeria | 11.7 /100 | #210 | Poor 4.1% |