Yugoslavian vs Immigrants from Turkey Professional Degree
COMPARE
Yugoslavian
Immigrants from Turkey
Professional Degree
Professional Degree Comparison
Yugoslavians
Immigrants from Turkey
4.1%
PROFESSIONAL DEGREE
13.4/ 100
METRIC RATING
206th/ 347
METRIC RANK
6.2%
PROFESSIONAL DEGREE
100.0/ 100
METRIC RATING
30th/ 347
METRIC RANK
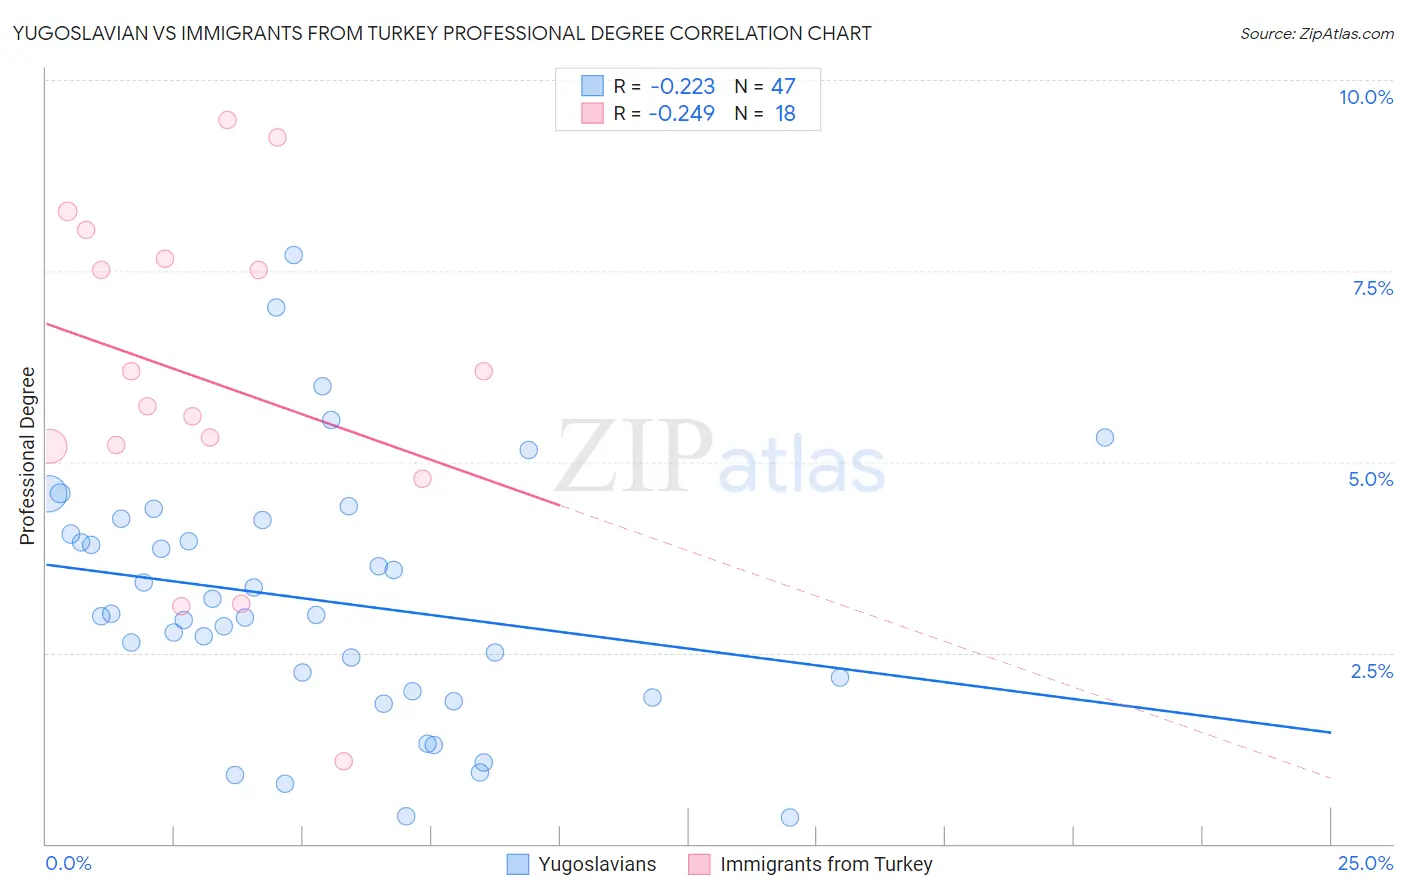
Yugoslavian vs Immigrants from Turkey Professional Degree Correlation Chart
The statistical analysis conducted on geographies consisting of 285,276,070 people shows a weak negative correlation between the proportion of Yugoslavians and percentage of population with at least professional degree education in the United States with a correlation coefficient (R) of -0.223 and weighted average of 4.1%. Similarly, the statistical analysis conducted on geographies consisting of 222,933,233 people shows a weak negative correlation between the proportion of Immigrants from Turkey and percentage of population with at least professional degree education in the United States with a correlation coefficient (R) of -0.249 and weighted average of 6.2%, a difference of 50.1%.
Professional Degree Correlation Summary
| Measurement | Yugoslavian | Immigrants from Turkey |
| Minimum | 0.35% | 1.1% |
| Maximum | 7.7% | 9.5% |
| Range | 7.4% | 8.4% |
| Mean | 3.2% | 6.1% |
| Median | 3.0% | 6.0% |
| Interquartile 25% (IQ1) | 2.0% | 5.2% |
| Interquartile 75% (IQ3) | 4.2% | 7.7% |
| Interquartile Range (IQR) | 2.2% | 2.5% |
| Standard Deviation (Sample) | 1.6% | 2.2% |
| Standard Deviation (Population) | 1.6% | 2.2% |
Similar Demographics by Professional Degree
Demographics Similar to Yugoslavians by Professional Degree
In terms of professional degree, the demographic groups most similar to Yugoslavians are Subsaharan African (4.1%, a difference of 0.24%), Immigrants from Somalia (4.1%, a difference of 0.32%), Immigrants from Panama (4.1%, a difference of 0.40%), Somali (4.1%, a difference of 0.42%), and Immigrants from Nigeria (4.1%, a difference of 0.62%).
| Demographics | Rating | Rank | Professional Degree |
| Norwegians | 20.5 /100 | #199 | Fair 4.2% |
| Immigrants | North Macedonia | 20.2 /100 | #200 | Fair 4.2% |
| Finns | 18.7 /100 | #201 | Poor 4.2% |
| Immigrants | Iraq | 17.1 /100 | #202 | Poor 4.2% |
| Panamanians | 15.9 /100 | #203 | Poor 4.1% |
| Barbadians | 15.8 /100 | #204 | Poor 4.1% |
| Somalis | 14.8 /100 | #205 | Poor 4.1% |
| Yugoslavians | 13.4 /100 | #206 | Poor 4.1% |
| Sub-Saharan Africans | 12.8 /100 | #207 | Poor 4.1% |
| Immigrants | Somalia | 12.5 /100 | #208 | Poor 4.1% |
| Immigrants | Panama | 12.3 /100 | #209 | Poor 4.1% |
| Immigrants | Nigeria | 11.7 /100 | #210 | Poor 4.1% |
| Germans | 11.6 /100 | #211 | Poor 4.1% |
| Whites/Caucasians | 11.2 /100 | #212 | Poor 4.1% |
| Koreans | 10.7 /100 | #213 | Poor 4.1% |
Demographics Similar to Immigrants from Turkey by Professional Degree
In terms of professional degree, the demographic groups most similar to Immigrants from Turkey are Immigrants from Sri Lanka (6.2%, a difference of 0.0%), Immigrants from India (6.2%, a difference of 0.12%), Thai (6.1%, a difference of 0.35%), Burmese (6.1%, a difference of 0.39%), and Mongolian (6.1%, a difference of 0.52%).
| Demographics | Rating | Rank | Professional Degree |
| Russians | 100.0 /100 | #23 | Exceptional 6.3% |
| Immigrants | Spain | 100.0 /100 | #24 | Exceptional 6.3% |
| Immigrants | Ireland | 100.0 /100 | #25 | Exceptional 6.3% |
| Latvians | 100.0 /100 | #26 | Exceptional 6.2% |
| Immigrants | Northern Europe | 100.0 /100 | #27 | Exceptional 6.2% |
| Turks | 100.0 /100 | #28 | Exceptional 6.2% |
| Immigrants | Sri Lanka | 100.0 /100 | #29 | Exceptional 6.2% |
| Immigrants | Turkey | 100.0 /100 | #30 | Exceptional 6.2% |
| Immigrants | India | 100.0 /100 | #31 | Exceptional 6.2% |
| Thais | 100.0 /100 | #32 | Exceptional 6.1% |
| Burmese | 100.0 /100 | #33 | Exceptional 6.1% |
| Mongolians | 100.0 /100 | #34 | Exceptional 6.1% |
| Immigrants | Korea | 100.0 /100 | #35 | Exceptional 6.1% |
| Immigrants | Russia | 100.0 /100 | #36 | Exceptional 6.0% |
| Immigrants | Austria | 100.0 /100 | #37 | Exceptional 6.0% |