Yugoslavian vs Maltese Professional Degree
COMPARE
Yugoslavian
Maltese
Professional Degree
Professional Degree Comparison
Yugoslavians
Maltese
4.1%
PROFESSIONAL DEGREE
13.4/ 100
METRIC RATING
206th/ 347
METRIC RANK
5.0%
PROFESSIONAL DEGREE
98.1/ 100
METRIC RATING
107th/ 347
METRIC RANK
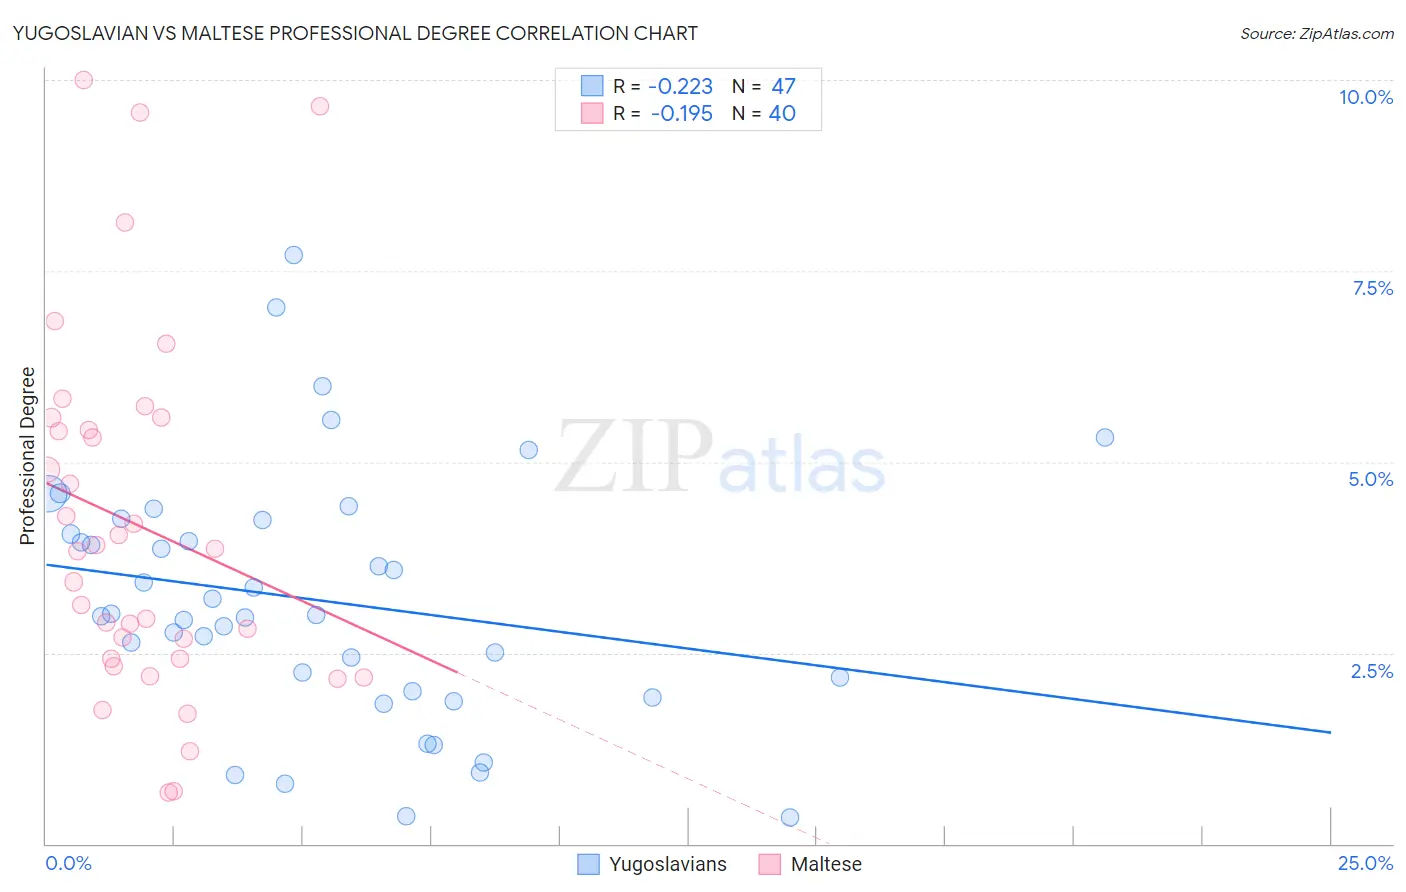
Yugoslavian vs Maltese Professional Degree Correlation Chart
The statistical analysis conducted on geographies consisting of 285,276,070 people shows a weak negative correlation between the proportion of Yugoslavians and percentage of population with at least professional degree education in the United States with a correlation coefficient (R) of -0.223 and weighted average of 4.1%. Similarly, the statistical analysis conducted on geographies consisting of 126,398,771 people shows a poor negative correlation between the proportion of Maltese and percentage of population with at least professional degree education in the United States with a correlation coefficient (R) of -0.195 and weighted average of 5.0%, a difference of 22.6%.
Professional Degree Correlation Summary
| Measurement | Yugoslavian | Maltese |
| Minimum | 0.35% | 0.68% |
| Maximum | 7.7% | 10.0% |
| Range | 7.4% | 9.3% |
| Mean | 3.2% | 4.2% |
| Median | 3.0% | 3.9% |
| Interquartile 25% (IQ1) | 2.0% | 2.4% |
| Interquartile 75% (IQ3) | 4.2% | 5.5% |
| Interquartile Range (IQR) | 2.2% | 3.1% |
| Standard Deviation (Sample) | 1.6% | 2.4% |
| Standard Deviation (Population) | 1.6% | 2.3% |
Similar Demographics by Professional Degree
Demographics Similar to Yugoslavians by Professional Degree
In terms of professional degree, the demographic groups most similar to Yugoslavians are Subsaharan African (4.1%, a difference of 0.24%), Immigrants from Somalia (4.1%, a difference of 0.32%), Immigrants from Panama (4.1%, a difference of 0.40%), Somali (4.1%, a difference of 0.42%), and Immigrants from Nigeria (4.1%, a difference of 0.62%).
| Demographics | Rating | Rank | Professional Degree |
| Norwegians | 20.5 /100 | #199 | Fair 4.2% |
| Immigrants | North Macedonia | 20.2 /100 | #200 | Fair 4.2% |
| Finns | 18.7 /100 | #201 | Poor 4.2% |
| Immigrants | Iraq | 17.1 /100 | #202 | Poor 4.2% |
| Panamanians | 15.9 /100 | #203 | Poor 4.1% |
| Barbadians | 15.8 /100 | #204 | Poor 4.1% |
| Somalis | 14.8 /100 | #205 | Poor 4.1% |
| Yugoslavians | 13.4 /100 | #206 | Poor 4.1% |
| Sub-Saharan Africans | 12.8 /100 | #207 | Poor 4.1% |
| Immigrants | Somalia | 12.5 /100 | #208 | Poor 4.1% |
| Immigrants | Panama | 12.3 /100 | #209 | Poor 4.1% |
| Immigrants | Nigeria | 11.7 /100 | #210 | Poor 4.1% |
| Germans | 11.6 /100 | #211 | Poor 4.1% |
| Whites/Caucasians | 11.2 /100 | #212 | Poor 4.1% |
| Koreans | 10.7 /100 | #213 | Poor 4.1% |
Demographics Similar to Maltese by Professional Degree
In terms of professional degree, the demographic groups most similar to Maltese are Immigrants from Southern Europe (5.0%, a difference of 0.040%), British (5.0%, a difference of 0.060%), Immigrants from Ukraine (5.0%, a difference of 0.12%), Immigrants from Uganda (5.0%, a difference of 0.15%), and Arab (5.0%, a difference of 0.17%).
| Demographics | Rating | Rank | Professional Degree |
| Ugandans | 98.8 /100 | #100 | Exceptional 5.1% |
| Immigrants | Egypt | 98.5 /100 | #101 | Exceptional 5.1% |
| Ukrainians | 98.5 /100 | #102 | Exceptional 5.1% |
| Immigrants | Northern Africa | 98.4 /100 | #103 | Exceptional 5.1% |
| Arabs | 98.2 /100 | #104 | Exceptional 5.0% |
| Immigrants | Uganda | 98.2 /100 | #105 | Exceptional 5.0% |
| Immigrants | Ukraine | 98.2 /100 | #106 | Exceptional 5.0% |
| Maltese | 98.1 /100 | #107 | Exceptional 5.0% |
| Immigrants | Southern Europe | 98.1 /100 | #108 | Exceptional 5.0% |
| British | 98.0 /100 | #109 | Exceptional 5.0% |
| Lebanese | 98.0 /100 | #110 | Exceptional 5.0% |
| Brazilians | 97.4 /100 | #111 | Exceptional 5.0% |
| Taiwanese | 97.3 /100 | #112 | Exceptional 5.0% |
| Immigrants | Pakistan | 97.2 /100 | #113 | Exceptional 5.0% |
| Immigrants | Morocco | 96.8 /100 | #114 | Exceptional 5.0% |