Serbian vs Scandinavian Professional Degree
COMPARE
Serbian
Scandinavian
Professional Degree
Professional Degree Comparison
Serbians
Scandinavians
4.8%
PROFESSIONAL DEGREE
92.6/ 100
METRIC RATING
127th/ 347
METRIC RANK
4.2%
PROFESSIONAL DEGREE
25.8/ 100
METRIC RATING
194th/ 347
METRIC RANK
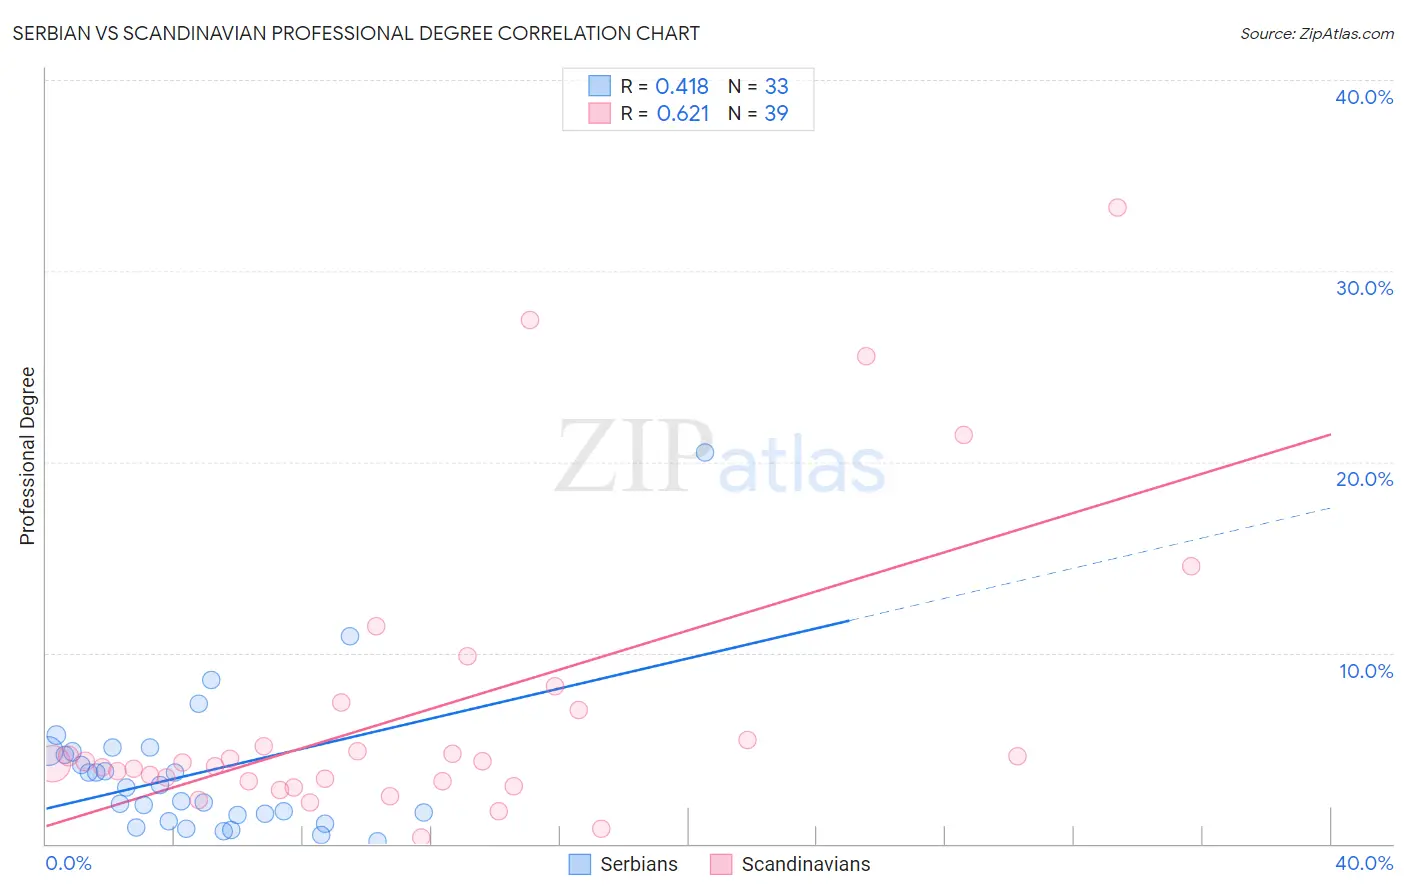
Serbian vs Scandinavian Professional Degree Correlation Chart
The statistical analysis conducted on geographies consisting of 267,248,415 people shows a moderate positive correlation between the proportion of Serbians and percentage of population with at least professional degree education in the United States with a correlation coefficient (R) of 0.418 and weighted average of 4.8%. Similarly, the statistical analysis conducted on geographies consisting of 469,840,840 people shows a significant positive correlation between the proportion of Scandinavians and percentage of population with at least professional degree education in the United States with a correlation coefficient (R) of 0.621 and weighted average of 4.2%, a difference of 13.5%.
Professional Degree Correlation Summary
| Measurement | Serbian | Scandinavian |
| Minimum | 0.11% | 0.33% |
| Maximum | 20.5% | 33.3% |
| Range | 20.4% | 33.0% |
| Mean | 3.7% | 6.9% |
| Median | 2.9% | 4.2% |
| Interquartile 25% (IQ1) | 1.4% | 3.3% |
| Interquartile 75% (IQ3) | 4.8% | 7.0% |
| Interquartile Range (IQR) | 3.5% | 3.8% |
| Standard Deviation (Sample) | 3.9% | 7.5% |
| Standard Deviation (Population) | 3.8% | 7.4% |
Similar Demographics by Professional Degree
Demographics Similar to Serbians by Professional Degree
In terms of professional degree, the demographic groups most similar to Serbians are Immigrants from Eastern Africa (4.8%, a difference of 0.020%), European (4.8%, a difference of 0.30%), Immigrants from Albania (4.8%, a difference of 0.35%), Immigrants from Eritrea (4.8%, a difference of 0.47%), and Palestinian (4.8%, a difference of 0.48%).
| Demographics | Rating | Rank | Professional Degree |
| Albanians | 95.3 /100 | #120 | Exceptional 4.9% |
| Immigrants | Moldova | 94.8 /100 | #121 | Exceptional 4.9% |
| Immigrants | Germany | 94.1 /100 | #122 | Exceptional 4.9% |
| Immigrants | Venezuela | 93.8 /100 | #123 | Exceptional 4.8% |
| Immigrants | Eritrea | 93.5 /100 | #124 | Exceptional 4.8% |
| Immigrants | Albania | 93.3 /100 | #125 | Exceptional 4.8% |
| Europeans | 93.2 /100 | #126 | Exceptional 4.8% |
| Serbians | 92.6 /100 | #127 | Exceptional 4.8% |
| Immigrants | Eastern Africa | 92.5 /100 | #128 | Exceptional 4.8% |
| Palestinians | 91.5 /100 | #129 | Exceptional 4.8% |
| Icelanders | 91.5 /100 | #130 | Exceptional 4.8% |
| Immigrants | Nepal | 91.4 /100 | #131 | Exceptional 4.8% |
| Pakistanis | 90.9 /100 | #132 | Exceptional 4.8% |
| Italians | 90.2 /100 | #133 | Exceptional 4.8% |
| South American Indians | 89.9 /100 | #134 | Excellent 4.8% |
Demographics Similar to Scandinavians by Professional Degree
In terms of professional degree, the demographic groups most similar to Scandinavians are Nigerian (4.2%, a difference of 0.24%), French (4.2%, a difference of 0.25%), Ghanaian (4.3%, a difference of 0.29%), Spanish (4.2%, a difference of 0.57%), and Sri Lankan (4.3%, a difference of 0.62%).
| Demographics | Rating | Rank | Professional Degree |
| Immigrants | Cameroon | 33.3 /100 | #187 | Fair 4.3% |
| Immigrants | Thailand | 31.7 /100 | #188 | Fair 4.3% |
| Slovaks | 30.7 /100 | #189 | Fair 4.3% |
| Immigrants | Poland | 29.2 /100 | #190 | Fair 4.3% |
| Sri Lankans | 29.0 /100 | #191 | Fair 4.3% |
| Ghanaians | 27.3 /100 | #192 | Fair 4.3% |
| French | 27.1 /100 | #193 | Fair 4.2% |
| Scandinavians | 25.8 /100 | #194 | Fair 4.2% |
| Nigerians | 24.6 /100 | #195 | Fair 4.2% |
| Spanish | 23.0 /100 | #196 | Fair 4.2% |
| Czechoslovakians | 22.4 /100 | #197 | Fair 4.2% |
| Immigrants | Middle Africa | 22.1 /100 | #198 | Fair 4.2% |
| Norwegians | 20.5 /100 | #199 | Fair 4.2% |
| Immigrants | North Macedonia | 20.2 /100 | #200 | Fair 4.2% |
| Finns | 18.7 /100 | #201 | Poor 4.2% |