Yugoslavian vs Scandinavian Disability Age 18 to 34
COMPARE
Yugoslavian
Scandinavian
Disability Age 18 to 34
Disability Age 18 to 34 Comparison
Yugoslavians
Scandinavians
7.2%
DISABILITY AGE 18 TO 34
0.8/ 100
METRIC RATING
247th/ 347
METRIC RANK
7.7%
DISABILITY AGE 18 TO 34
0.0/ 100
METRIC RATING
293rd/ 347
METRIC RANK
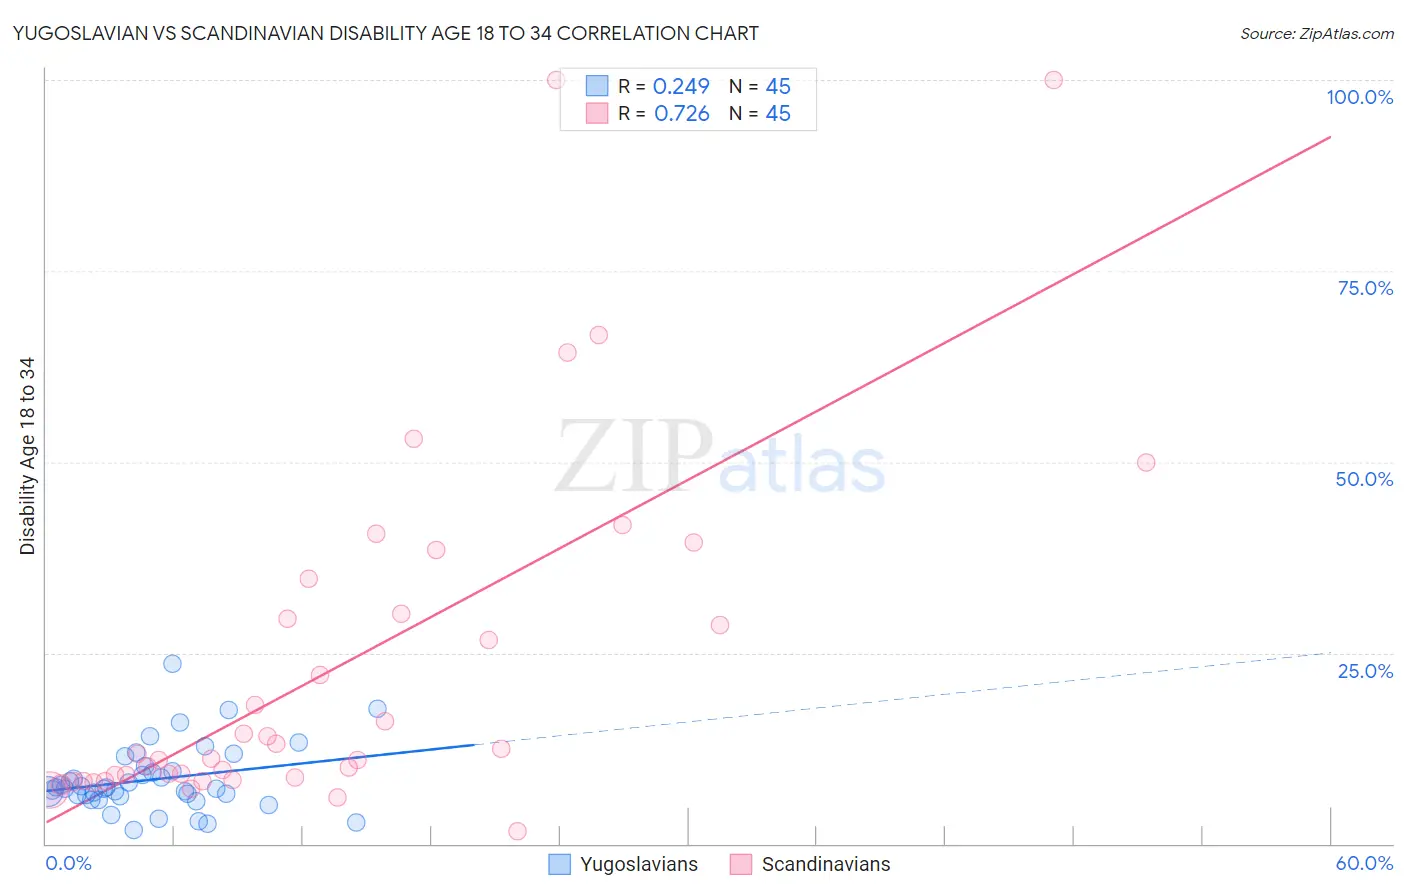
Yugoslavian vs Scandinavian Disability Age 18 to 34 Correlation Chart
The statistical analysis conducted on geographies consisting of 285,257,895 people shows a weak positive correlation between the proportion of Yugoslavians and percentage of population with a disability between the ages 18 and 35 in the United States with a correlation coefficient (R) of 0.249 and weighted average of 7.2%. Similarly, the statistical analysis conducted on geographies consisting of 470,294,545 people shows a strong positive correlation between the proportion of Scandinavians and percentage of population with a disability between the ages 18 and 35 in the United States with a correlation coefficient (R) of 0.726 and weighted average of 7.7%, a difference of 7.3%.
Disability Age 18 to 34 Correlation Summary
| Measurement | Yugoslavian | Scandinavian |
| Minimum | 1.9% | 1.6% |
| Maximum | 23.6% | 100.0% |
| Range | 21.8% | 98.4% |
| Mean | 8.4% | 23.4% |
| Median | 7.2% | 11.8% |
| Interquartile 25% (IQ1) | 6.3% | 8.4% |
| Interquartile 75% (IQ3) | 9.8% | 32.4% |
| Interquartile Range (IQR) | 3.5% | 24.0% |
| Standard Deviation (Sample) | 4.3% | 23.3% |
| Standard Deviation (Population) | 4.3% | 23.0% |
Similar Demographics by Disability Age 18 to 34
Demographics Similar to Yugoslavians by Disability Age 18 to 34
In terms of disability age 18 to 34, the demographic groups most similar to Yugoslavians are Guamanian/Chamorro (7.2%, a difference of 0.040%), Malaysian (7.2%, a difference of 0.13%), Immigrants from Liberia (7.1%, a difference of 0.15%), Hungarian (7.1%, a difference of 0.17%), and Immigrants from Zaire (7.1%, a difference of 0.27%).
| Demographics | Rating | Rank | Disability Age 18 to 34 |
| Arapaho | 1.1 /100 | #240 | Tragic 7.1% |
| Nepalese | 1.1 /100 | #241 | Tragic 7.1% |
| Immigrants | Congo | 1.1 /100 | #242 | Tragic 7.1% |
| Icelanders | 1.0 /100 | #243 | Tragic 7.1% |
| Immigrants | Zaire | 0.9 /100 | #244 | Tragic 7.1% |
| Hungarians | 0.9 /100 | #245 | Tragic 7.1% |
| Immigrants | Liberia | 0.8 /100 | #246 | Tragic 7.1% |
| Yugoslavians | 0.8 /100 | #247 | Tragic 7.2% |
| Guamanians/Chamorros | 0.8 /100 | #248 | Tragic 7.2% |
| Malaysians | 0.7 /100 | #249 | Tragic 7.2% |
| Fijians | 0.6 /100 | #250 | Tragic 7.2% |
| Spaniards | 0.6 /100 | #251 | Tragic 7.2% |
| Poles | 0.6 /100 | #252 | Tragic 7.2% |
| Croatians | 0.5 /100 | #253 | Tragic 7.2% |
| Indonesians | 0.4 /100 | #254 | Tragic 7.2% |
Demographics Similar to Scandinavians by Disability Age 18 to 34
In terms of disability age 18 to 34, the demographic groups most similar to Scandinavians are Black/African American (7.7%, a difference of 0.060%), Immigrants from Cabo Verde (7.7%, a difference of 0.15%), Tlingit-Haida (7.7%, a difference of 0.16%), Irish (7.7%, a difference of 0.28%), and Slovak (7.7%, a difference of 0.33%).
| Demographics | Rating | Rank | Disability Age 18 to 34 |
| Celtics | 0.0 /100 | #286 | Tragic 7.6% |
| Norwegians | 0.0 /100 | #287 | Tragic 7.6% |
| Whites/Caucasians | 0.0 /100 | #288 | Tragic 7.6% |
| Immigrants | Nonimmigrants | 0.0 /100 | #289 | Tragic 7.6% |
| Slovaks | 0.0 /100 | #290 | Tragic 7.7% |
| Irish | 0.0 /100 | #291 | Tragic 7.7% |
| Blacks/African Americans | 0.0 /100 | #292 | Tragic 7.7% |
| Scandinavians | 0.0 /100 | #293 | Tragic 7.7% |
| Immigrants | Cabo Verde | 0.0 /100 | #294 | Tragic 7.7% |
| Tlingit-Haida | 0.0 /100 | #295 | Tragic 7.7% |
| Cape Verdeans | 0.0 /100 | #296 | Tragic 7.7% |
| Pueblo | 0.0 /100 | #297 | Tragic 7.7% |
| Dutch | 0.0 /100 | #298 | Tragic 7.7% |
| Germans | 0.0 /100 | #299 | Tragic 7.7% |
| Scottish | 0.0 /100 | #300 | Tragic 7.7% |