Yugoslavian vs Immigrants from Barbados Professional Degree
COMPARE
Yugoslavian
Immigrants from Barbados
Professional Degree
Professional Degree Comparison
Yugoslavians
Immigrants from Barbados
4.1%
PROFESSIONAL DEGREE
13.4/ 100
METRIC RATING
206th/ 347
METRIC RANK
3.9%
PROFESSIONAL DEGREE
4.0/ 100
METRIC RATING
235th/ 347
METRIC RANK
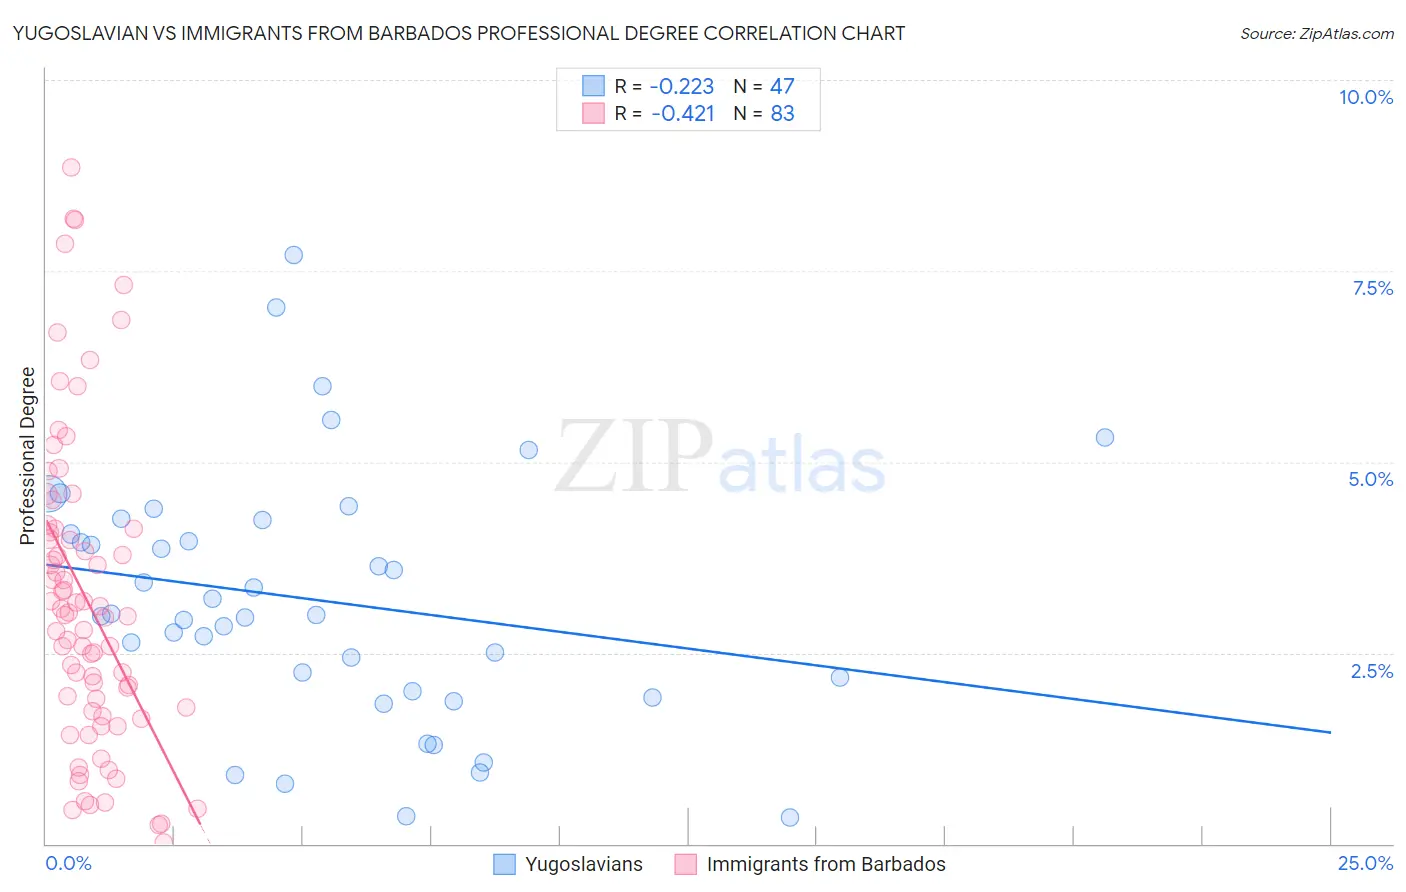
Yugoslavian vs Immigrants from Barbados Professional Degree Correlation Chart
The statistical analysis conducted on geographies consisting of 285,276,070 people shows a weak negative correlation between the proportion of Yugoslavians and percentage of population with at least professional degree education in the United States with a correlation coefficient (R) of -0.223 and weighted average of 4.1%. Similarly, the statistical analysis conducted on geographies consisting of 112,711,705 people shows a moderate negative correlation between the proportion of Immigrants from Barbados and percentage of population with at least professional degree education in the United States with a correlation coefficient (R) of -0.421 and weighted average of 3.9%, a difference of 5.4%.
Professional Degree Correlation Summary
| Measurement | Yugoslavian | Immigrants from Barbados |
| Minimum | 0.35% | 0.017% |
| Maximum | 7.7% | 8.9% |
| Range | 7.4% | 8.8% |
| Mean | 3.2% | 3.2% |
| Median | 3.0% | 3.0% |
| Interquartile 25% (IQ1) | 2.0% | 1.7% |
| Interquartile 75% (IQ3) | 4.2% | 4.1% |
| Interquartile Range (IQR) | 2.2% | 2.4% |
| Standard Deviation (Sample) | 1.6% | 2.0% |
| Standard Deviation (Population) | 1.6% | 2.0% |
Similar Demographics by Professional Degree
Demographics Similar to Yugoslavians by Professional Degree
In terms of professional degree, the demographic groups most similar to Yugoslavians are Subsaharan African (4.1%, a difference of 0.24%), Immigrants from Somalia (4.1%, a difference of 0.32%), Immigrants from Panama (4.1%, a difference of 0.40%), Somali (4.1%, a difference of 0.42%), and Immigrants from Nigeria (4.1%, a difference of 0.62%).
| Demographics | Rating | Rank | Professional Degree |
| Norwegians | 20.5 /100 | #199 | Fair 4.2% |
| Immigrants | North Macedonia | 20.2 /100 | #200 | Fair 4.2% |
| Finns | 18.7 /100 | #201 | Poor 4.2% |
| Immigrants | Iraq | 17.1 /100 | #202 | Poor 4.2% |
| Panamanians | 15.9 /100 | #203 | Poor 4.1% |
| Barbadians | 15.8 /100 | #204 | Poor 4.1% |
| Somalis | 14.8 /100 | #205 | Poor 4.1% |
| Yugoslavians | 13.4 /100 | #206 | Poor 4.1% |
| Sub-Saharan Africans | 12.8 /100 | #207 | Poor 4.1% |
| Immigrants | Somalia | 12.5 /100 | #208 | Poor 4.1% |
| Immigrants | Panama | 12.3 /100 | #209 | Poor 4.1% |
| Immigrants | Nigeria | 11.7 /100 | #210 | Poor 4.1% |
| Germans | 11.6 /100 | #211 | Poor 4.1% |
| Whites/Caucasians | 11.2 /100 | #212 | Poor 4.1% |
| Koreans | 10.7 /100 | #213 | Poor 4.1% |
Demographics Similar to Immigrants from Barbados by Professional Degree
In terms of professional degree, the demographic groups most similar to Immigrants from Barbados are Nonimmigrants (3.9%, a difference of 0.010%), Immigrants from Philippines (3.9%, a difference of 0.050%), Spanish American (3.9%, a difference of 0.22%), Immigrants from Trinidad and Tobago (3.9%, a difference of 0.29%), and Cree (3.9%, a difference of 0.31%).
| Demographics | Rating | Rank | Professional Degree |
| Immigrants | West Indies | 5.6 /100 | #228 | Tragic 4.0% |
| Immigrants | Burma/Myanmar | 5.4 /100 | #229 | Tragic 3.9% |
| Nicaraguans | 5.1 /100 | #230 | Tragic 3.9% |
| Ecuadorians | 4.6 /100 | #231 | Tragic 3.9% |
| Cree | 4.3 /100 | #232 | Tragic 3.9% |
| Immigrants | Philippines | 4.1 /100 | #233 | Tragic 3.9% |
| Immigrants | Nonimmigrants | 4.0 /100 | #234 | Tragic 3.9% |
| Immigrants | Barbados | 4.0 /100 | #235 | Tragic 3.9% |
| Spanish Americans | 3.8 /100 | #236 | Tragic 3.9% |
| Immigrants | Trinidad and Tobago | 3.8 /100 | #237 | Tragic 3.9% |
| Colville | 2.6 /100 | #238 | Tragic 3.8% |
| British West Indians | 2.4 /100 | #239 | Tragic 3.8% |
| Immigrants | Ecuador | 2.3 /100 | #240 | Tragic 3.8% |
| Alaskan Athabascans | 2.3 /100 | #241 | Tragic 3.8% |
| Native Hawaiians | 2.3 /100 | #242 | Tragic 3.8% |