Yugoslavian vs Albanian GED/Equivalency
COMPARE
Yugoslavian
Albanian
GED/Equivalency
GED/Equivalency Comparison
Yugoslavians
Albanians
86.7%
GED/EQUIVALENCY
89.5/ 100
METRIC RATING
128th/ 347
METRIC RANK
86.6%
GED/EQUIVALENCY
87.7/ 100
METRIC RATING
134th/ 347
METRIC RANK
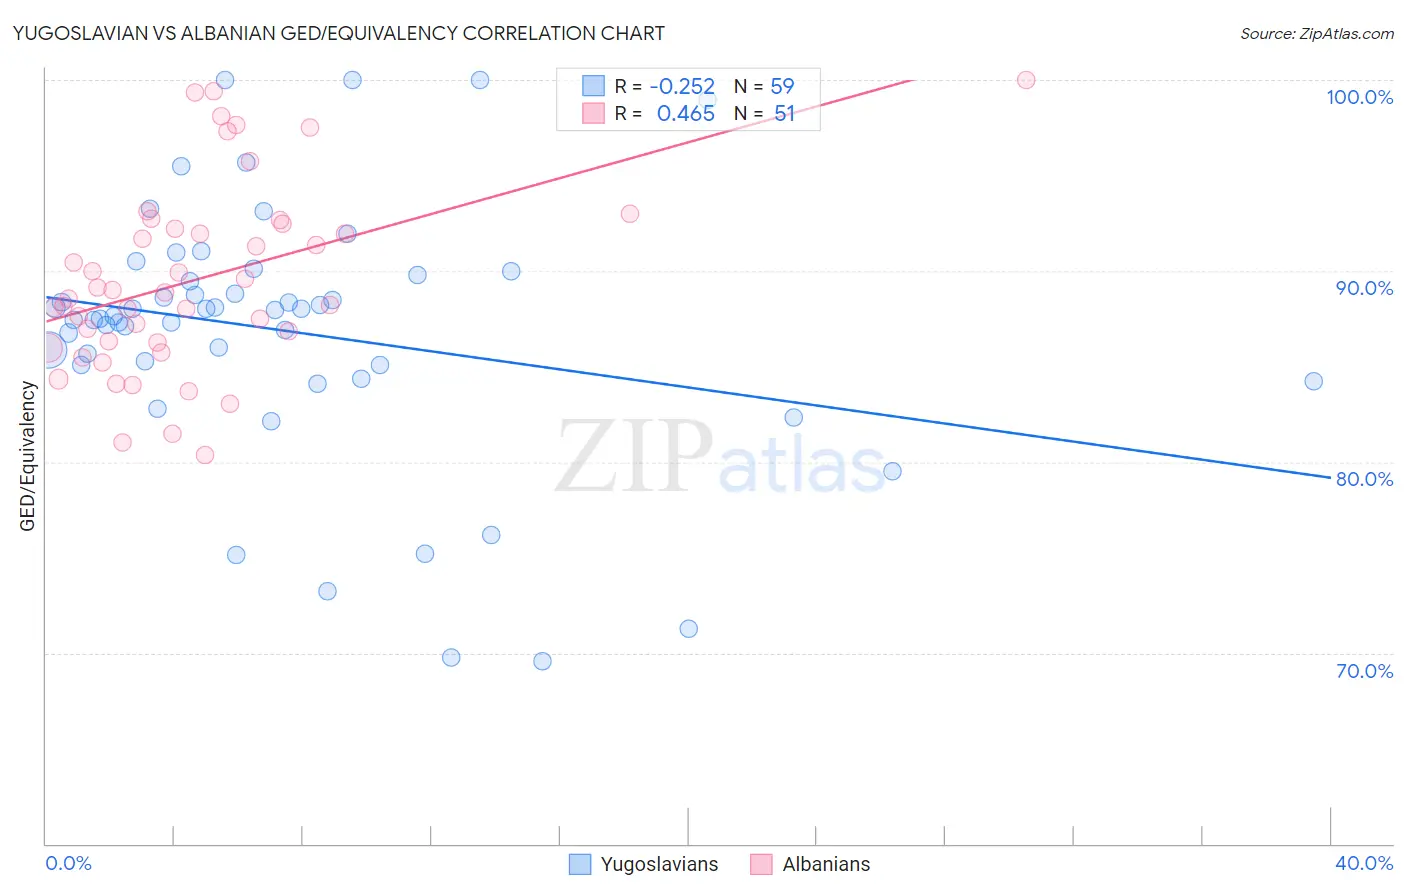
Yugoslavian vs Albanian GED/Equivalency Correlation Chart
The statistical analysis conducted on geographies consisting of 285,719,638 people shows a weak negative correlation between the proportion of Yugoslavians and percentage of population with at least ged/equivalency education in the United States with a correlation coefficient (R) of -0.252 and weighted average of 86.7%. Similarly, the statistical analysis conducted on geographies consisting of 193,265,279 people shows a moderate positive correlation between the proportion of Albanians and percentage of population with at least ged/equivalency education in the United States with a correlation coefficient (R) of 0.465 and weighted average of 86.6%, a difference of 0.090%.
GED/Equivalency Correlation Summary
| Measurement | Yugoslavian | Albanian |
| Minimum | 69.6% | 80.3% |
| Maximum | 100.0% | 100.0% |
| Range | 30.4% | 19.7% |
| Mean | 86.8% | 89.6% |
| Median | 87.6% | 88.9% |
| Interquartile 25% (IQ1) | 85.1% | 86.3% |
| Interquartile 75% (IQ3) | 89.8% | 92.5% |
| Interquartile Range (IQR) | 4.7% | 6.2% |
| Standard Deviation (Sample) | 6.7% | 4.9% |
| Standard Deviation (Population) | 6.6% | 4.8% |
Demographics Similar to Yugoslavians and Albanians by GED/Equivalency
In terms of ged/equivalency, the demographic groups most similar to Yugoslavians are Argentinean (86.7%, a difference of 0.010%), Immigrants from Ukraine (86.7%, a difference of 0.030%), Immigrants from Germany (86.7%, a difference of 0.030%), Asian (86.7%, a difference of 0.040%), and Immigrants from Egypt (86.7%, a difference of 0.050%). Similarly, the demographic groups most similar to Albanians are Immigrants from Asia (86.6%, a difference of 0.010%), Immigrants from Brazil (86.6%, a difference of 0.030%), Tsimshian (86.6%, a difference of 0.030%), Immigrants from Spain (86.7%, a difference of 0.040%), and Chilean (86.6%, a difference of 0.040%).
| Demographics | Rating | Rank | GED/Equivalency |
| Immigrants | Lebanon | 90.9 /100 | #121 | Exceptional 86.8% |
| Immigrants | Jordan | 90.8 /100 | #122 | Exceptional 86.8% |
| Immigrants | Italy | 90.5 /100 | #123 | Exceptional 86.7% |
| Immigrants | Egypt | 90.4 /100 | #124 | Exceptional 86.7% |
| Celtics | 90.4 /100 | #125 | Exceptional 86.7% |
| Asians | 90.3 /100 | #126 | Exceptional 86.7% |
| Argentineans | 89.7 /100 | #127 | Excellent 86.7% |
| Yugoslavians | 89.5 /100 | #128 | Excellent 86.7% |
| Immigrants | Ukraine | 88.9 /100 | #129 | Excellent 86.7% |
| Immigrants | Germany | 88.8 /100 | #130 | Excellent 86.7% |
| Immigrants | Spain | 88.5 /100 | #131 | Excellent 86.7% |
| Immigrants | Brazil | 88.4 /100 | #132 | Excellent 86.6% |
| Tsimshian | 88.3 /100 | #133 | Excellent 86.6% |
| Albanians | 87.7 /100 | #134 | Excellent 86.6% |
| Immigrants | Asia | 87.4 /100 | #135 | Excellent 86.6% |
| Chileans | 86.9 /100 | #136 | Excellent 86.6% |
| Arabs | 86.7 /100 | #137 | Excellent 86.6% |
| Immigrants | Argentina | 86.5 /100 | #138 | Excellent 86.6% |
| Immigrants | Malaysia | 85.0 /100 | #139 | Excellent 86.5% |
| Paraguayans | 84.1 /100 | #140 | Excellent 86.5% |
| Laotians | 83.2 /100 | #141 | Excellent 86.5% |