Yugoslavian vs Yuman GED/Equivalency
COMPARE
Yugoslavian
Yuman
GED/Equivalency
GED/Equivalency Comparison
Yugoslavians
Yuman
86.7%
GED/EQUIVALENCY
89.5/ 100
METRIC RATING
128th/ 347
METRIC RANK
79.2%
GED/EQUIVALENCY
0.0/ 100
METRIC RATING
326th/ 347
METRIC RANK
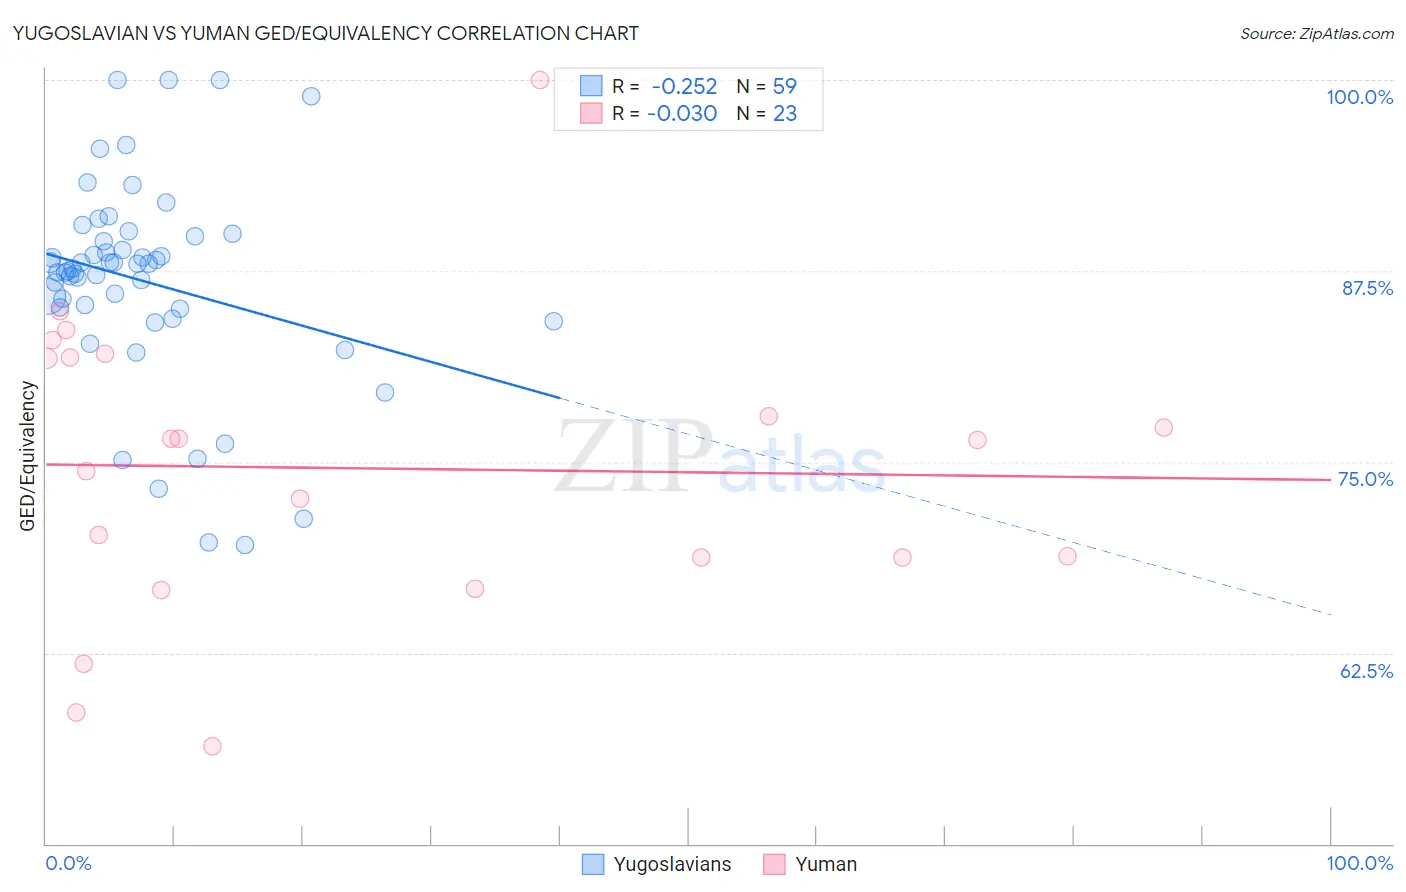
Yugoslavian vs Yuman GED/Equivalency Correlation Chart
The statistical analysis conducted on geographies consisting of 285,719,638 people shows a weak negative correlation between the proportion of Yugoslavians and percentage of population with at least ged/equivalency education in the United States with a correlation coefficient (R) of -0.252 and weighted average of 86.7%. Similarly, the statistical analysis conducted on geographies consisting of 40,696,349 people shows no correlation between the proportion of Yuman and percentage of population with at least ged/equivalency education in the United States with a correlation coefficient (R) of -0.030 and weighted average of 79.2%, a difference of 9.5%.
GED/Equivalency Correlation Summary
| Measurement | Yugoslavian | Yuman |
| Minimum | 69.6% | 56.4% |
| Maximum | 100.0% | 100.0% |
| Range | 30.4% | 43.6% |
| Mean | 86.8% | 74.6% |
| Median | 87.6% | 76.5% |
| Interquartile 25% (IQ1) | 85.1% | 68.8% |
| Interquartile 75% (IQ3) | 89.8% | 81.9% |
| Interquartile Range (IQR) | 4.7% | 13.1% |
| Standard Deviation (Sample) | 6.7% | 9.8% |
| Standard Deviation (Population) | 6.6% | 9.5% |
Similar Demographics by GED/Equivalency
Demographics Similar to Yugoslavians by GED/Equivalency
In terms of ged/equivalency, the demographic groups most similar to Yugoslavians are Argentinean (86.7%, a difference of 0.010%), Immigrants from Ukraine (86.7%, a difference of 0.030%), Immigrants from Germany (86.7%, a difference of 0.030%), Asian (86.7%, a difference of 0.040%), and Immigrants from Egypt (86.7%, a difference of 0.050%).
| Demographics | Rating | Rank | GED/Equivalency |
| Immigrants | Lebanon | 90.9 /100 | #121 | Exceptional 86.8% |
| Immigrants | Jordan | 90.8 /100 | #122 | Exceptional 86.8% |
| Immigrants | Italy | 90.5 /100 | #123 | Exceptional 86.7% |
| Immigrants | Egypt | 90.4 /100 | #124 | Exceptional 86.7% |
| Celtics | 90.4 /100 | #125 | Exceptional 86.7% |
| Asians | 90.3 /100 | #126 | Exceptional 86.7% |
| Argentineans | 89.7 /100 | #127 | Excellent 86.7% |
| Yugoslavians | 89.5 /100 | #128 | Excellent 86.7% |
| Immigrants | Ukraine | 88.9 /100 | #129 | Excellent 86.7% |
| Immigrants | Germany | 88.8 /100 | #130 | Excellent 86.7% |
| Immigrants | Spain | 88.5 /100 | #131 | Excellent 86.7% |
| Immigrants | Brazil | 88.4 /100 | #132 | Excellent 86.6% |
| Tsimshian | 88.3 /100 | #133 | Excellent 86.6% |
| Albanians | 87.7 /100 | #134 | Excellent 86.6% |
| Immigrants | Asia | 87.4 /100 | #135 | Excellent 86.6% |
Demographics Similar to Yuman by GED/Equivalency
In terms of ged/equivalency, the demographic groups most similar to Yuman are Central American (79.2%, a difference of 0.020%), Honduran (79.3%, a difference of 0.090%), Hispanic or Latino (79.1%, a difference of 0.13%), Dominican (79.1%, a difference of 0.17%), and Mexican American Indian (79.4%, a difference of 0.21%).
| Demographics | Rating | Rank | GED/Equivalency |
| Immigrants | Belize | 0.0 /100 | #319 | Tragic 80.5% |
| Immigrants | Cuba | 0.0 /100 | #320 | Tragic 80.2% |
| Yup'ik | 0.0 /100 | #321 | Tragic 80.0% |
| Lumbee | 0.0 /100 | #322 | Tragic 80.0% |
| Immigrants | Nicaragua | 0.0 /100 | #323 | Tragic 79.9% |
| Mexican American Indians | 0.0 /100 | #324 | Tragic 79.4% |
| Hondurans | 0.0 /100 | #325 | Tragic 79.3% |
| Yuman | 0.0 /100 | #326 | Tragic 79.2% |
| Central Americans | 0.0 /100 | #327 | Tragic 79.2% |
| Hispanics or Latinos | 0.0 /100 | #328 | Tragic 79.1% |
| Dominicans | 0.0 /100 | #329 | Tragic 79.1% |
| Immigrants | Cabo Verde | 0.0 /100 | #330 | Tragic 78.9% |
| Immigrants | Honduras | 0.0 /100 | #331 | Tragic 78.7% |
| Immigrants | Azores | 0.0 /100 | #332 | Tragic 78.7% |
| Salvadorans | 0.0 /100 | #333 | Tragic 78.6% |