Iroquois vs Ugandan Bachelor's Degree
COMPARE
Iroquois
Ugandan
Bachelor's Degree
Bachelor's Degree Comparison
Iroquois
Ugandans
33.2%
BACHELOR'S DEGREE
0.7/ 100
METRIC RATING
255th/ 347
METRIC RANK
40.8%
BACHELOR'S DEGREE
96.3/ 100
METRIC RATING
112th/ 347
METRIC RANK
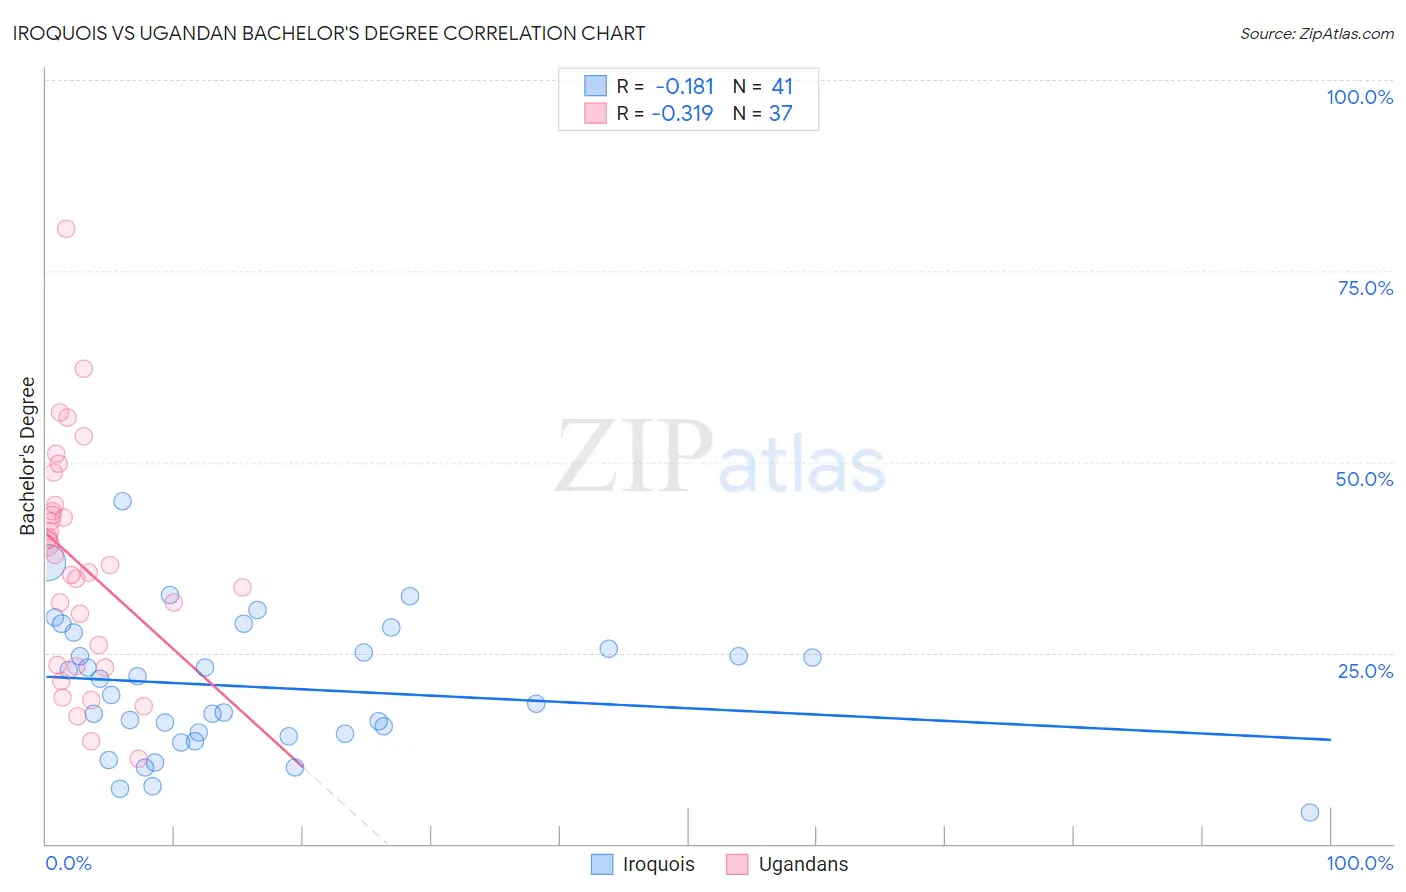
Iroquois vs Ugandan Bachelor's Degree Correlation Chart
The statistical analysis conducted on geographies consisting of 207,306,427 people shows a poor negative correlation between the proportion of Iroquois and percentage of population with at least bachelor's degree education in the United States with a correlation coefficient (R) of -0.181 and weighted average of 33.2%. Similarly, the statistical analysis conducted on geographies consisting of 94,016,399 people shows a mild negative correlation between the proportion of Ugandans and percentage of population with at least bachelor's degree education in the United States with a correlation coefficient (R) of -0.319 and weighted average of 40.8%, a difference of 23.0%.
Bachelor's Degree Correlation Summary
| Measurement | Iroquois | Ugandan |
| Minimum | 4.2% | 11.1% |
| Maximum | 44.8% | 80.5% |
| Range | 40.6% | 69.4% |
| Mean | 20.5% | 36.6% |
| Median | 19.5% | 36.6% |
| Interquartile 25% (IQ1) | 14.2% | 23.3% |
| Interquartile 75% (IQ3) | 26.5% | 43.9% |
| Interquartile Range (IQR) | 12.3% | 20.6% |
| Standard Deviation (Sample) | 8.7% | 14.9% |
| Standard Deviation (Population) | 8.6% | 14.7% |
Similar Demographics by Bachelor's Degree
Demographics Similar to Iroquois by Bachelor's Degree
In terms of bachelor's degree, the demographic groups most similar to Iroquois are Native Hawaiian (33.2%, a difference of 0.020%), U.S. Virgin Islander (33.2%, a difference of 0.080%), Nicaraguan (33.1%, a difference of 0.19%), Immigrants from Bahamas (33.3%, a difference of 0.28%), and Japanese (33.3%, a difference of 0.36%).
| Demographics | Rating | Rank | Bachelor's Degree |
| Cree | 1.0 /100 | #248 | Tragic 33.6% |
| Immigrants | Liberia | 0.9 /100 | #249 | Tragic 33.5% |
| Indonesians | 0.9 /100 | #250 | Tragic 33.5% |
| Japanese | 0.7 /100 | #251 | Tragic 33.3% |
| Immigrants | Bahamas | 0.7 /100 | #252 | Tragic 33.3% |
| U.S. Virgin Islanders | 0.7 /100 | #253 | Tragic 33.2% |
| Native Hawaiians | 0.7 /100 | #254 | Tragic 33.2% |
| Iroquois | 0.7 /100 | #255 | Tragic 33.2% |
| Nicaraguans | 0.6 /100 | #256 | Tragic 33.1% |
| Spanish Americans | 0.6 /100 | #257 | Tragic 33.1% |
| French American Indians | 0.6 /100 | #258 | Tragic 33.1% |
| Osage | 0.5 /100 | #259 | Tragic 33.0% |
| Malaysians | 0.5 /100 | #260 | Tragic 32.9% |
| Africans | 0.5 /100 | #261 | Tragic 32.9% |
| Immigrants | Jamaica | 0.5 /100 | #262 | Tragic 32.9% |
Demographics Similar to Ugandans by Bachelor's Degree
In terms of bachelor's degree, the demographic groups most similar to Ugandans are Brazilian (40.8%, a difference of 0.040%), Immigrants from Chile (40.8%, a difference of 0.050%), Afghan (40.8%, a difference of 0.070%), Albanian (40.9%, a difference of 0.090%), and Arab (40.9%, a difference of 0.17%).
| Demographics | Rating | Rank | Bachelor's Degree |
| Syrians | 97.4 /100 | #105 | Exceptional 41.1% |
| Alsatians | 97.0 /100 | #106 | Exceptional 41.0% |
| Northern Europeans | 96.8 /100 | #107 | Exceptional 41.0% |
| Ukrainians | 96.6 /100 | #108 | Exceptional 40.9% |
| Arabs | 96.6 /100 | #109 | Exceptional 40.9% |
| Albanians | 96.5 /100 | #110 | Exceptional 40.9% |
| Immigrants | Chile | 96.4 /100 | #111 | Exceptional 40.8% |
| Ugandans | 96.3 /100 | #112 | Exceptional 40.8% |
| Brazilians | 96.3 /100 | #113 | Exceptional 40.8% |
| Afghans | 96.2 /100 | #114 | Exceptional 40.8% |
| Palestinians | 95.8 /100 | #115 | Exceptional 40.7% |
| Immigrants | Uganda | 95.7 /100 | #116 | Exceptional 40.7% |
| Austrians | 95.5 /100 | #117 | Exceptional 40.6% |
| Croatians | 95.5 /100 | #118 | Exceptional 40.6% |
| Immigrants | Syria | 94.9 /100 | #119 | Exceptional 40.5% |