Slovene vs Ugandan Bachelor's Degree
COMPARE
Slovene
Ugandan
Bachelor's Degree
Bachelor's Degree Comparison
Slovenes
Ugandans
39.1%
BACHELOR'S DEGREE
79.5/ 100
METRIC RATING
145th/ 347
METRIC RANK
40.8%
BACHELOR'S DEGREE
96.3/ 100
METRIC RATING
112th/ 347
METRIC RANK
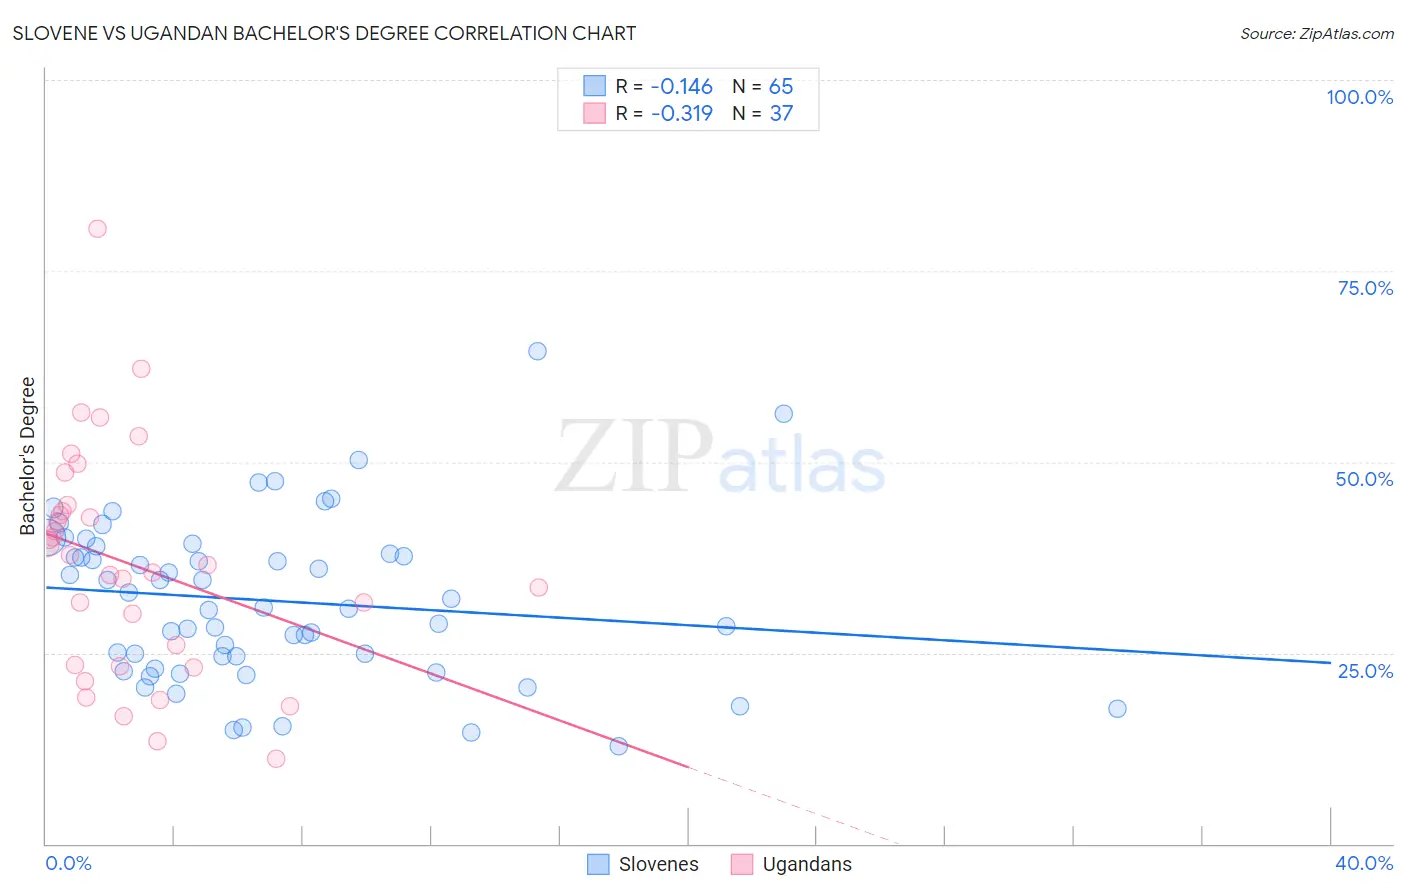
Slovene vs Ugandan Bachelor's Degree Correlation Chart
The statistical analysis conducted on geographies consisting of 261,339,823 people shows a poor negative correlation between the proportion of Slovenes and percentage of population with at least bachelor's degree education in the United States with a correlation coefficient (R) of -0.146 and weighted average of 39.1%. Similarly, the statistical analysis conducted on geographies consisting of 94,016,399 people shows a mild negative correlation between the proportion of Ugandans and percentage of population with at least bachelor's degree education in the United States with a correlation coefficient (R) of -0.319 and weighted average of 40.8%, a difference of 4.5%.
Bachelor's Degree Correlation Summary
| Measurement | Slovene | Ugandan |
| Minimum | 12.8% | 11.1% |
| Maximum | 64.4% | 80.5% |
| Range | 51.7% | 69.4% |
| Mean | 31.8% | 36.6% |
| Median | 30.9% | 36.6% |
| Interquartile 25% (IQ1) | 23.8% | 23.3% |
| Interquartile 75% (IQ3) | 38.5% | 43.9% |
| Interquartile Range (IQR) | 14.7% | 20.6% |
| Standard Deviation (Sample) | 10.6% | 14.9% |
| Standard Deviation (Population) | 10.5% | 14.7% |
Similar Demographics by Bachelor's Degree
Demographics Similar to Slovenes by Bachelor's Degree
In terms of bachelor's degree, the demographic groups most similar to Slovenes are Immigrants from Afghanistan (39.1%, a difference of 0.030%), Swedish (39.1%, a difference of 0.040%), Polish (39.1%, a difference of 0.050%), Immigrants from Sierra Leone (39.0%, a difference of 0.070%), and Iraqi (39.0%, a difference of 0.21%).
| Demographics | Rating | Rank | Bachelor's Degree |
| Europeans | 85.6 /100 | #138 | Excellent 39.5% |
| Immigrants | Sudan | 84.5 /100 | #139 | Excellent 39.4% |
| Immigrants | Armenia | 84.1 /100 | #140 | Excellent 39.4% |
| South American Indians | 83.6 /100 | #141 | Excellent 39.3% |
| Immigrants | North Macedonia | 81.6 /100 | #142 | Excellent 39.2% |
| Poles | 79.8 /100 | #143 | Good 39.1% |
| Immigrants | Afghanistan | 79.7 /100 | #144 | Good 39.1% |
| Slovenes | 79.5 /100 | #145 | Good 39.1% |
| Swedes | 79.2 /100 | #146 | Good 39.1% |
| Immigrants | Sierra Leone | 79.0 /100 | #147 | Good 39.0% |
| Iraqis | 78.1 /100 | #148 | Good 39.0% |
| Immigrants | Poland | 77.5 /100 | #149 | Good 39.0% |
| South Americans | 77.3 /100 | #150 | Good 38.9% |
| Immigrants | Africa | 76.5 /100 | #151 | Good 38.9% |
| Sudanese | 76.4 /100 | #152 | Good 38.9% |
Demographics Similar to Ugandans by Bachelor's Degree
In terms of bachelor's degree, the demographic groups most similar to Ugandans are Brazilian (40.8%, a difference of 0.040%), Immigrants from Chile (40.8%, a difference of 0.050%), Afghan (40.8%, a difference of 0.070%), Albanian (40.9%, a difference of 0.090%), and Arab (40.9%, a difference of 0.17%).
| Demographics | Rating | Rank | Bachelor's Degree |
| Syrians | 97.4 /100 | #105 | Exceptional 41.1% |
| Alsatians | 97.0 /100 | #106 | Exceptional 41.0% |
| Northern Europeans | 96.8 /100 | #107 | Exceptional 41.0% |
| Ukrainians | 96.6 /100 | #108 | Exceptional 40.9% |
| Arabs | 96.6 /100 | #109 | Exceptional 40.9% |
| Albanians | 96.5 /100 | #110 | Exceptional 40.9% |
| Immigrants | Chile | 96.4 /100 | #111 | Exceptional 40.8% |
| Ugandans | 96.3 /100 | #112 | Exceptional 40.8% |
| Brazilians | 96.3 /100 | #113 | Exceptional 40.8% |
| Afghans | 96.2 /100 | #114 | Exceptional 40.8% |
| Palestinians | 95.8 /100 | #115 | Exceptional 40.7% |
| Immigrants | Uganda | 95.7 /100 | #116 | Exceptional 40.7% |
| Austrians | 95.5 /100 | #117 | Exceptional 40.6% |
| Croatians | 95.5 /100 | #118 | Exceptional 40.6% |
| Immigrants | Syria | 94.9 /100 | #119 | Exceptional 40.5% |