Yaqui vs Ugandan 7th Grade
COMPARE
Yaqui
Ugandan
7th Grade
7th Grade Comparison
Yaqui
Ugandans
94.6%
7TH GRADE
0.0/ 100
METRIC RATING
295th/ 347
METRIC RANK
96.2%
7TH GRADE
75.5/ 100
METRIC RATING
157th/ 347
METRIC RANK
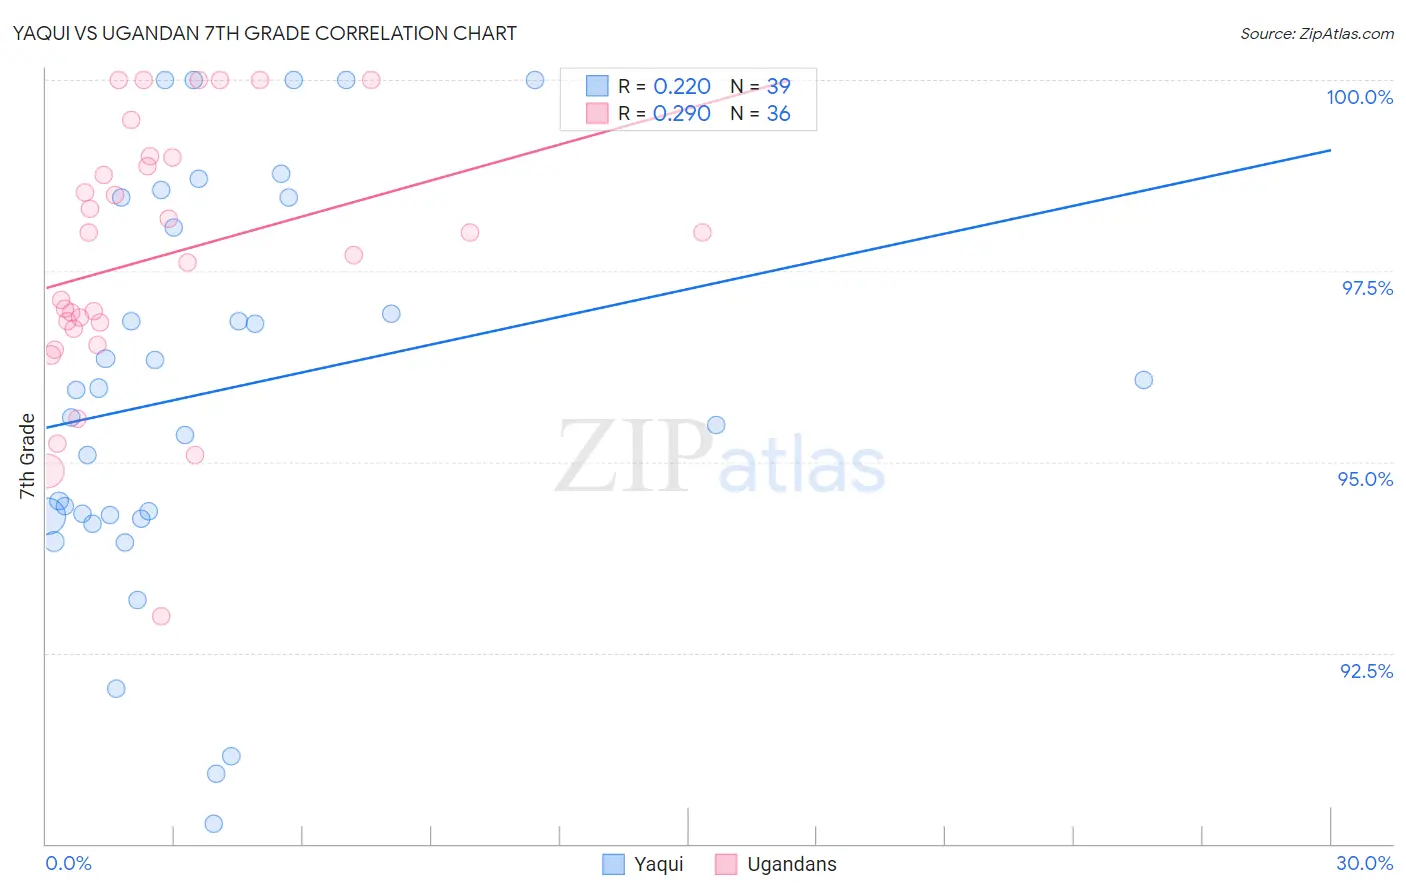
Yaqui vs Ugandan 7th Grade Correlation Chart
The statistical analysis conducted on geographies consisting of 107,725,021 people shows a weak positive correlation between the proportion of Yaqui and percentage of population with at least 7th grade education in the United States with a correlation coefficient (R) of 0.220 and weighted average of 94.6%. Similarly, the statistical analysis conducted on geographies consisting of 93,991,892 people shows a weak positive correlation between the proportion of Ugandans and percentage of population with at least 7th grade education in the United States with a correlation coefficient (R) of 0.290 and weighted average of 96.2%, a difference of 1.7%.
7th Grade Correlation Summary
| Measurement | Yaqui | Ugandan |
| Minimum | 90.3% | 93.0% |
| Maximum | 100.0% | 100.0% |
| Range | 9.7% | 7.0% |
| Mean | 95.9% | 97.7% |
| Median | 95.9% | 97.9% |
| Interquartile 25% (IQ1) | 94.3% | 96.8% |
| Interquartile 75% (IQ3) | 98.5% | 98.9% |
| Interquartile Range (IQR) | 4.2% | 2.1% |
| Standard Deviation (Sample) | 2.6% | 1.7% |
| Standard Deviation (Population) | 2.6% | 1.7% |
Similar Demographics by 7th Grade
Demographics Similar to Yaqui by 7th Grade
In terms of 7th grade, the demographic groups most similar to Yaqui are Cuban (94.6%, a difference of 0.010%), Haitian (94.7%, a difference of 0.030%), Fijian (94.7%, a difference of 0.11%), Immigrants from South Eastern Asia (94.5%, a difference of 0.11%), and Indonesian (94.5%, a difference of 0.11%).
| Demographics | Rating | Rank | 7th Grade |
| British West Indians | 0.0 /100 | #288 | Tragic 94.8% |
| Taiwanese | 0.0 /100 | #289 | Tragic 94.8% |
| Malaysians | 0.0 /100 | #290 | Tragic 94.8% |
| Immigrants | Grenada | 0.0 /100 | #291 | Tragic 94.8% |
| Immigrants | West Indies | 0.0 /100 | #292 | Tragic 94.8% |
| Fijians | 0.0 /100 | #293 | Tragic 94.7% |
| Haitians | 0.0 /100 | #294 | Tragic 94.7% |
| Yaqui | 0.0 /100 | #295 | Tragic 94.6% |
| Cubans | 0.0 /100 | #296 | Tragic 94.6% |
| Immigrants | South Eastern Asia | 0.0 /100 | #297 | Tragic 94.5% |
| Indonesians | 0.0 /100 | #298 | Tragic 94.5% |
| Bangladeshis | 0.0 /100 | #299 | Tragic 94.5% |
| Immigrants | Burma/Myanmar | 0.0 /100 | #300 | Tragic 94.5% |
| Immigrants | Dominica | 0.0 /100 | #301 | Tragic 94.5% |
| Immigrants | Laos | 0.0 /100 | #302 | Tragic 94.5% |
Demographics Similar to Ugandans by 7th Grade
In terms of 7th grade, the demographic groups most similar to Ugandans are Immigrants from Jordan (96.2%, a difference of 0.010%), Kenyan (96.2%, a difference of 0.010%), Seminole (96.2%, a difference of 0.020%), Immigrants from Israel (96.2%, a difference of 0.020%), and Immigrants from Russia (96.2%, a difference of 0.030%).
| Demographics | Rating | Rank | 7th Grade |
| Immigrants | Belarus | 82.4 /100 | #150 | Excellent 96.3% |
| Hopi | 81.6 /100 | #151 | Excellent 96.3% |
| Immigrants | Russia | 78.4 /100 | #152 | Good 96.2% |
| Seminole | 78.1 /100 | #153 | Good 96.2% |
| Immigrants | Israel | 77.6 /100 | #154 | Good 96.2% |
| Immigrants | Jordan | 77.0 /100 | #155 | Good 96.2% |
| Kenyans | 76.2 /100 | #156 | Good 96.2% |
| Ugandans | 75.5 /100 | #157 | Good 96.2% |
| Arabs | 68.6 /100 | #158 | Good 96.2% |
| Alsatians | 67.2 /100 | #159 | Good 96.1% |
| Immigrants | Kenya | 66.8 /100 | #160 | Good 96.1% |
| Bermudans | 66.3 /100 | #161 | Good 96.1% |
| Pima | 64.3 /100 | #162 | Good 96.1% |
| Spaniards | 62.6 /100 | #163 | Good 96.1% |
| Immigrants | Italy | 62.1 /100 | #164 | Good 96.1% |