Immigrants from Greece vs Menominee Master's Degree
COMPARE
Immigrants from Greece
Menominee
Master's Degree
Master's Degree Comparison
Immigrants from Greece
Menominee
19.0%
MASTER'S DEGREE
100.0/ 100
METRIC RATING
43rd/ 347
METRIC RANK
10.2%
MASTER'S DEGREE
0.0/ 100
METRIC RATING
333rd/ 347
METRIC RANK
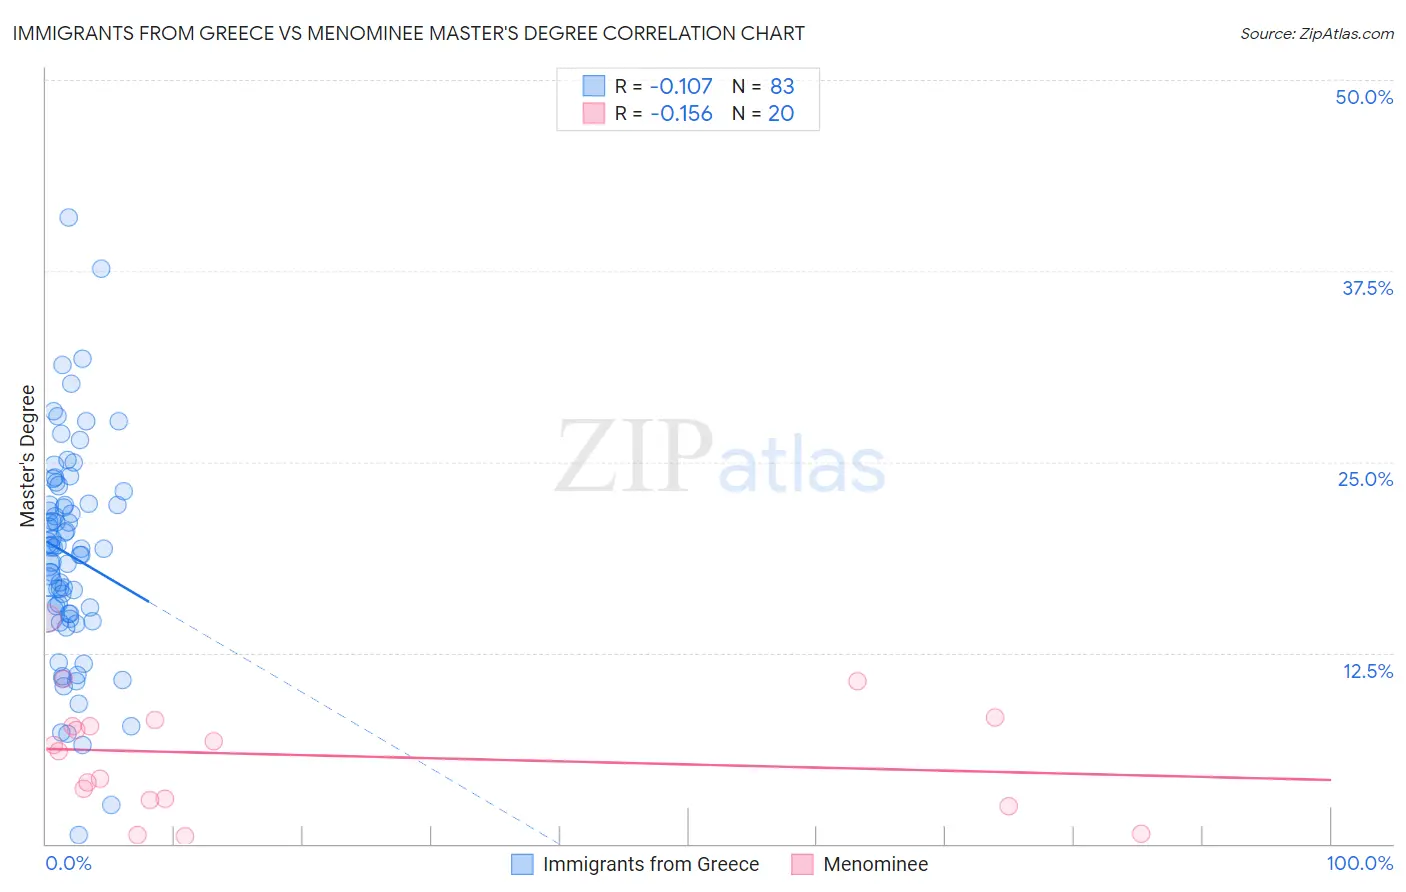
Immigrants from Greece vs Menominee Master's Degree Correlation Chart
The statistical analysis conducted on geographies consisting of 216,873,414 people shows a poor negative correlation between the proportion of Immigrants from Greece and percentage of population with at least master's degree education in the United States with a correlation coefficient (R) of -0.107 and weighted average of 19.0%. Similarly, the statistical analysis conducted on geographies consisting of 45,774,171 people shows a poor negative correlation between the proportion of Menominee and percentage of population with at least master's degree education in the United States with a correlation coefficient (R) of -0.156 and weighted average of 10.2%, a difference of 86.1%.
Master's Degree Correlation Summary
| Measurement | Immigrants from Greece | Menominee |
| Minimum | 0.57% | 0.53% |
| Maximum | 41.0% | 14.8% |
| Range | 40.4% | 14.2% |
| Mean | 18.9% | 5.8% |
| Median | 19.3% | 6.3% |
| Interquartile 25% (IQ1) | 15.1% | 2.9% |
| Interquartile 75% (IQ3) | 22.3% | 7.9% |
| Interquartile Range (IQR) | 7.2% | 5.0% |
| Standard Deviation (Sample) | 7.0% | 3.8% |
| Standard Deviation (Population) | 7.0% | 3.7% |
Similar Demographics by Master's Degree
Demographics Similar to Immigrants from Greece by Master's Degree
In terms of master's degree, the demographic groups most similar to Immigrants from Greece are Immigrants from Saudi Arabia (19.0%, a difference of 0.010%), Immigrants from Malaysia (18.9%, a difference of 0.28%), Immigrants from Belarus (18.9%, a difference of 0.39%), Immigrants from Latvia (19.1%, a difference of 0.44%), and Immigrants from Norway (18.8%, a difference of 0.78%).
| Demographics | Rating | Rank | Master's Degree |
| Immigrants | Russia | 100.0 /100 | #36 | Exceptional 19.4% |
| Mongolians | 100.0 /100 | #37 | Exceptional 19.4% |
| Bolivians | 100.0 /100 | #38 | Exceptional 19.3% |
| Immigrants | Spain | 100.0 /100 | #39 | Exceptional 19.1% |
| Immigrants | Bolivia | 100.0 /100 | #40 | Exceptional 19.1% |
| Immigrants | Latvia | 100.0 /100 | #41 | Exceptional 19.1% |
| Immigrants | Saudi Arabia | 100.0 /100 | #42 | Exceptional 19.0% |
| Immigrants | Greece | 100.0 /100 | #43 | Exceptional 19.0% |
| Immigrants | Malaysia | 100.0 /100 | #44 | Exceptional 18.9% |
| Immigrants | Belarus | 100.0 /100 | #45 | Exceptional 18.9% |
| Immigrants | Norway | 100.0 /100 | #46 | Exceptional 18.8% |
| Immigrants | Austria | 100.0 /100 | #47 | Exceptional 18.8% |
| Paraguayans | 100.0 /100 | #48 | Exceptional 18.8% |
| Estonians | 100.0 /100 | #49 | Exceptional 18.8% |
| Bulgarians | 100.0 /100 | #50 | Exceptional 18.8% |
Demographics Similar to Menominee by Master's Degree
In terms of master's degree, the demographic groups most similar to Menominee are Immigrants from the Azores (10.2%, a difference of 0.37%), Pueblo (10.3%, a difference of 0.83%), Fijian (10.3%, a difference of 1.0%), Arapaho (10.0%, a difference of 1.9%), and Immigrants from Central America (10.0%, a difference of 2.1%).
| Demographics | Rating | Rank | Master's Degree |
| Creek | 0.0 /100 | #326 | Tragic 10.5% |
| Paiute | 0.0 /100 | #327 | Tragic 10.5% |
| Bangladeshis | 0.0 /100 | #328 | Tragic 10.5% |
| Nepalese | 0.0 /100 | #329 | Tragic 10.5% |
| Fijians | 0.0 /100 | #330 | Tragic 10.3% |
| Pueblo | 0.0 /100 | #331 | Tragic 10.3% |
| Immigrants | Azores | 0.0 /100 | #332 | Tragic 10.2% |
| Menominee | 0.0 /100 | #333 | Tragic 10.2% |
| Arapaho | 0.0 /100 | #334 | Tragic 10.0% |
| Immigrants | Central America | 0.0 /100 | #335 | Tragic 10.0% |
| Natives/Alaskans | 0.0 /100 | #336 | Tragic 9.9% |
| Mexicans | 0.0 /100 | #337 | Tragic 9.7% |
| Tohono O'odham | 0.0 /100 | #338 | Tragic 9.7% |
| Spanish American Indians | 0.0 /100 | #339 | Tragic 9.6% |
| Yakama | 0.0 /100 | #340 | Tragic 9.5% |