Austrian vs Menominee Master's Degree
COMPARE
Austrian
Menominee
Master's Degree
Master's Degree Comparison
Austrians
Menominee
16.7%
MASTER'S DEGREE
97.8/ 100
METRIC RATING
111th/ 347
METRIC RANK
10.2%
MASTER'S DEGREE
0.0/ 100
METRIC RATING
333rd/ 347
METRIC RANK
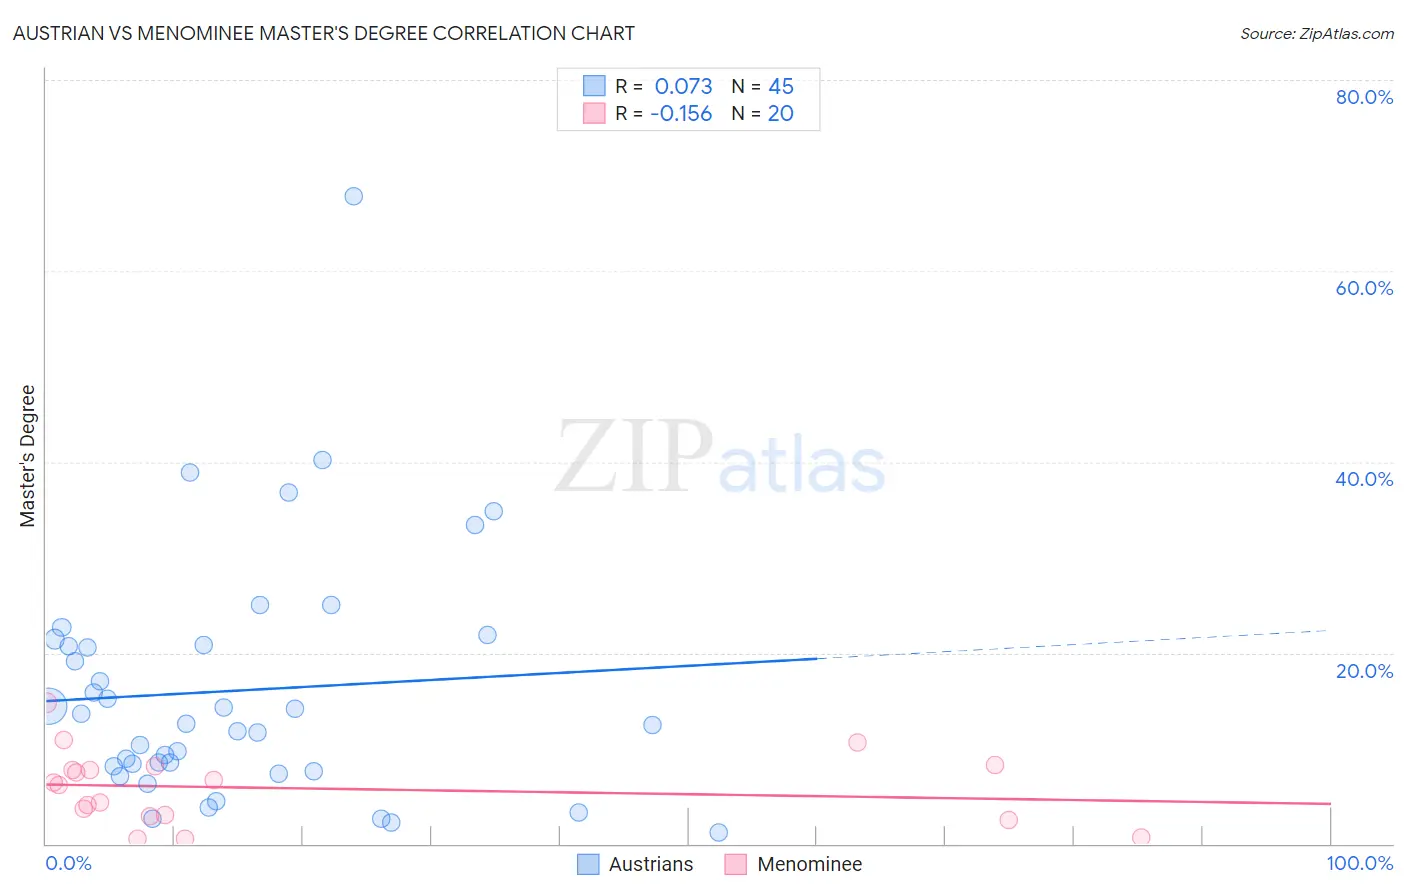
Austrian vs Menominee Master's Degree Correlation Chart
The statistical analysis conducted on geographies consisting of 451,930,170 people shows a slight positive correlation between the proportion of Austrians and percentage of population with at least master's degree education in the United States with a correlation coefficient (R) of 0.073 and weighted average of 16.7%. Similarly, the statistical analysis conducted on geographies consisting of 45,774,171 people shows a poor negative correlation between the proportion of Menominee and percentage of population with at least master's degree education in the United States with a correlation coefficient (R) of -0.156 and weighted average of 10.2%, a difference of 64.1%.
Master's Degree Correlation Summary
| Measurement | Austrian | Menominee |
| Minimum | 1.2% | 0.53% |
| Maximum | 67.9% | 14.8% |
| Range | 66.7% | 14.2% |
| Mean | 16.1% | 5.8% |
| Median | 12.6% | 6.3% |
| Interquartile 25% (IQ1) | 7.9% | 2.9% |
| Interquartile 75% (IQ3) | 21.1% | 7.9% |
| Interquartile Range (IQR) | 13.2% | 5.0% |
| Standard Deviation (Sample) | 12.8% | 3.8% |
| Standard Deviation (Population) | 12.7% | 3.7% |
Similar Demographics by Master's Degree
Demographics Similar to Austrians by Master's Degree
In terms of master's degree, the demographic groups most similar to Austrians are Macedonian (16.7%, a difference of 0.14%), Arab (16.7%, a difference of 0.15%), Northern European (16.7%, a difference of 0.22%), Immigrants from Chile (16.8%, a difference of 0.27%), and Moroccan (16.8%, a difference of 0.30%).
| Demographics | Rating | Rank | Master's Degree |
| Ukrainians | 98.3 /100 | #104 | Exceptional 16.9% |
| Syrians | 98.3 /100 | #105 | Exceptional 16.8% |
| Immigrants | Albania | 98.1 /100 | #106 | Exceptional 16.8% |
| Armenians | 98.0 /100 | #107 | Exceptional 16.8% |
| Sierra Leoneans | 98.0 /100 | #108 | Exceptional 16.8% |
| Moroccans | 98.0 /100 | #109 | Exceptional 16.8% |
| Immigrants | Chile | 98.0 /100 | #110 | Exceptional 16.8% |
| Austrians | 97.8 /100 | #111 | Exceptional 16.7% |
| Macedonians | 97.7 /100 | #112 | Exceptional 16.7% |
| Arabs | 97.7 /100 | #113 | Exceptional 16.7% |
| Northern Europeans | 97.6 /100 | #114 | Exceptional 16.7% |
| Immigrants | Uganda | 97.3 /100 | #115 | Exceptional 16.6% |
| Immigrants | Southern Europe | 97.2 /100 | #116 | Exceptional 16.6% |
| Immigrants | Moldova | 97.2 /100 | #117 | Exceptional 16.6% |
| Brazilians | 96.8 /100 | #118 | Exceptional 16.5% |
Demographics Similar to Menominee by Master's Degree
In terms of master's degree, the demographic groups most similar to Menominee are Immigrants from the Azores (10.2%, a difference of 0.37%), Pueblo (10.3%, a difference of 0.83%), Fijian (10.3%, a difference of 1.0%), Arapaho (10.0%, a difference of 1.9%), and Immigrants from Central America (10.0%, a difference of 2.1%).
| Demographics | Rating | Rank | Master's Degree |
| Creek | 0.0 /100 | #326 | Tragic 10.5% |
| Paiute | 0.0 /100 | #327 | Tragic 10.5% |
| Bangladeshis | 0.0 /100 | #328 | Tragic 10.5% |
| Nepalese | 0.0 /100 | #329 | Tragic 10.5% |
| Fijians | 0.0 /100 | #330 | Tragic 10.3% |
| Pueblo | 0.0 /100 | #331 | Tragic 10.3% |
| Immigrants | Azores | 0.0 /100 | #332 | Tragic 10.2% |
| Menominee | 0.0 /100 | #333 | Tragic 10.2% |
| Arapaho | 0.0 /100 | #334 | Tragic 10.0% |
| Immigrants | Central America | 0.0 /100 | #335 | Tragic 10.0% |
| Natives/Alaskans | 0.0 /100 | #336 | Tragic 9.9% |
| Mexicans | 0.0 /100 | #337 | Tragic 9.7% |
| Tohono O'odham | 0.0 /100 | #338 | Tragic 9.7% |
| Spanish American Indians | 0.0 /100 | #339 | Tragic 9.6% |
| Yakama | 0.0 /100 | #340 | Tragic 9.5% |