Yaqui vs Black/African American Associate's Degree
COMPARE
Yaqui
Black/African American
Associate's Degree
Associate's Degree Comparison
Yaqui
Blacks/African Americans
37.6%
ASSOCIATE'S DEGREE
0.0/ 100
METRIC RATING
317th/ 347
METRIC RANK
39.1%
ASSOCIATE'S DEGREE
0.0/ 100
METRIC RATING
292nd/ 347
METRIC RANK
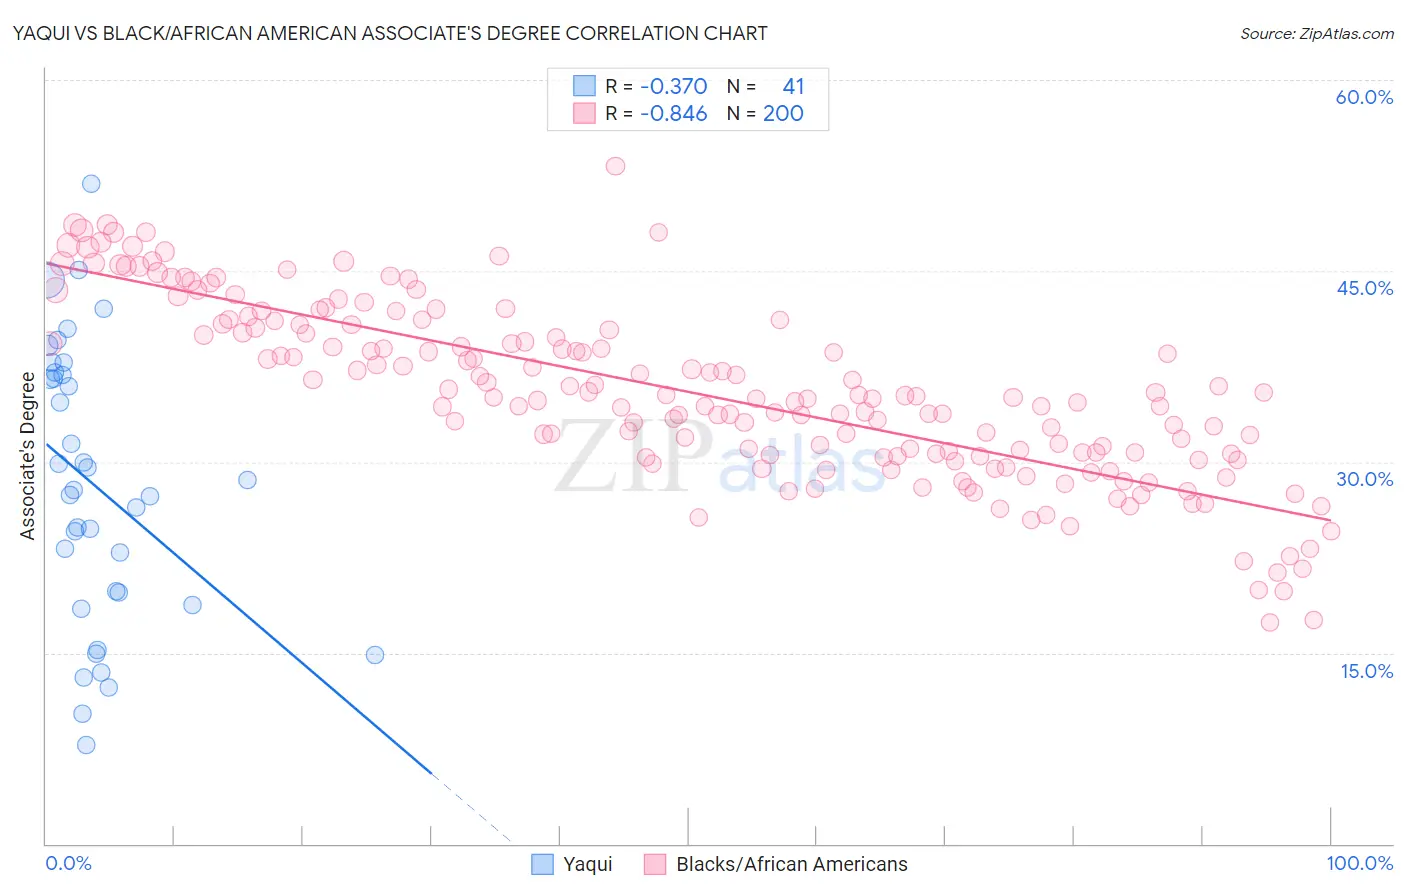
Yaqui vs Black/African American Associate's Degree Correlation Chart
The statistical analysis conducted on geographies consisting of 107,738,640 people shows a mild negative correlation between the proportion of Yaqui and percentage of population with at least associate's degree education in the United States with a correlation coefficient (R) of -0.370 and weighted average of 37.6%. Similarly, the statistical analysis conducted on geographies consisting of 565,941,999 people shows a very strong negative correlation between the proportion of Blacks/African Americans and percentage of population with at least associate's degree education in the United States with a correlation coefficient (R) of -0.846 and weighted average of 39.1%, a difference of 4.3%.
Associate's Degree Correlation Summary
| Measurement | Yaqui | Black/African American |
| Minimum | 7.7% | 17.4% |
| Maximum | 51.9% | 53.2% |
| Range | 44.1% | 35.8% |
| Mean | 28.1% | 35.5% |
| Median | 27.8% | 35.1% |
| Interquartile 25% (IQ1) | 19.2% | 30.6% |
| Interquartile 75% (IQ3) | 36.9% | 40.7% |
| Interquartile Range (IQR) | 17.7% | 10.1% |
| Standard Deviation (Sample) | 10.8% | 6.9% |
| Standard Deviation (Population) | 10.7% | 6.9% |
Similar Demographics by Associate's Degree
Demographics Similar to Yaqui by Associate's Degree
In terms of associate's degree, the demographic groups most similar to Yaqui are Creek (37.6%, a difference of 0.020%), Crow (37.6%, a difference of 0.020%), Alaska Native (37.5%, a difference of 0.23%), Seminole (37.7%, a difference of 0.41%), and Fijian (37.4%, a difference of 0.45%).
| Demographics | Rating | Rank | Associate's Degree |
| Immigrants | Dominican Republic | 0.0 /100 | #310 | Tragic 37.9% |
| Immigrants | Latin America | 0.0 /100 | #311 | Tragic 37.9% |
| Choctaw | 0.0 /100 | #312 | Tragic 37.8% |
| Hispanics or Latinos | 0.0 /100 | #313 | Tragic 37.7% |
| Seminole | 0.0 /100 | #314 | Tragic 37.7% |
| Creek | 0.0 /100 | #315 | Tragic 37.6% |
| Crow | 0.0 /100 | #316 | Tragic 37.6% |
| Yaqui | 0.0 /100 | #317 | Tragic 37.6% |
| Alaska Natives | 0.0 /100 | #318 | Tragic 37.5% |
| Fijians | 0.0 /100 | #319 | Tragic 37.4% |
| Cajuns | 0.0 /100 | #320 | Tragic 37.4% |
| Immigrants | Yemen | 0.0 /100 | #321 | Tragic 37.3% |
| Pennsylvania Germans | 0.0 /100 | #322 | Tragic 37.2% |
| Immigrants | Cabo Verde | 0.0 /100 | #323 | Tragic 36.8% |
| Arapaho | 0.0 /100 | #324 | Tragic 36.7% |
Demographics Similar to Blacks/African Americans by Associate's Degree
In terms of associate's degree, the demographic groups most similar to Blacks/African Americans are Nepalese (39.0%, a difference of 0.25%), Salvadoran (39.0%, a difference of 0.25%), Dominican (39.3%, a difference of 0.29%), Immigrants from Haiti (39.3%, a difference of 0.30%), and Honduran (38.9%, a difference of 0.54%).
| Demographics | Rating | Rank | Associate's Degree |
| Immigrants | Belize | 0.1 /100 | #285 | Tragic 39.9% |
| Immigrants | Caribbean | 0.0 /100 | #286 | Tragic 39.7% |
| Aleuts | 0.0 /100 | #287 | Tragic 39.6% |
| Immigrants | Cuba | 0.0 /100 | #288 | Tragic 39.5% |
| Central Americans | 0.0 /100 | #289 | Tragic 39.4% |
| Immigrants | Haiti | 0.0 /100 | #290 | Tragic 39.3% |
| Dominicans | 0.0 /100 | #291 | Tragic 39.3% |
| Blacks/African Americans | 0.0 /100 | #292 | Tragic 39.1% |
| Nepalese | 0.0 /100 | #293 | Tragic 39.0% |
| Salvadorans | 0.0 /100 | #294 | Tragic 39.0% |
| Hondurans | 0.0 /100 | #295 | Tragic 38.9% |
| Cherokee | 0.0 /100 | #296 | Tragic 38.9% |
| Cape Verdeans | 0.0 /100 | #297 | Tragic 38.8% |
| Cheyenne | 0.0 /100 | #298 | Tragic 38.7% |
| Ute | 0.0 /100 | #299 | Tragic 38.6% |