Immigrants from Thailand vs Black/African American Associate's Degree
COMPARE
Immigrants from Thailand
Black/African American
Associate's Degree
Associate's Degree Comparison
Immigrants from Thailand
Blacks/African Americans
45.1%
ASSOCIATE'S DEGREE
18.9/ 100
METRIC RATING
205th/ 347
METRIC RANK
39.1%
ASSOCIATE'S DEGREE
0.0/ 100
METRIC RATING
292nd/ 347
METRIC RANK
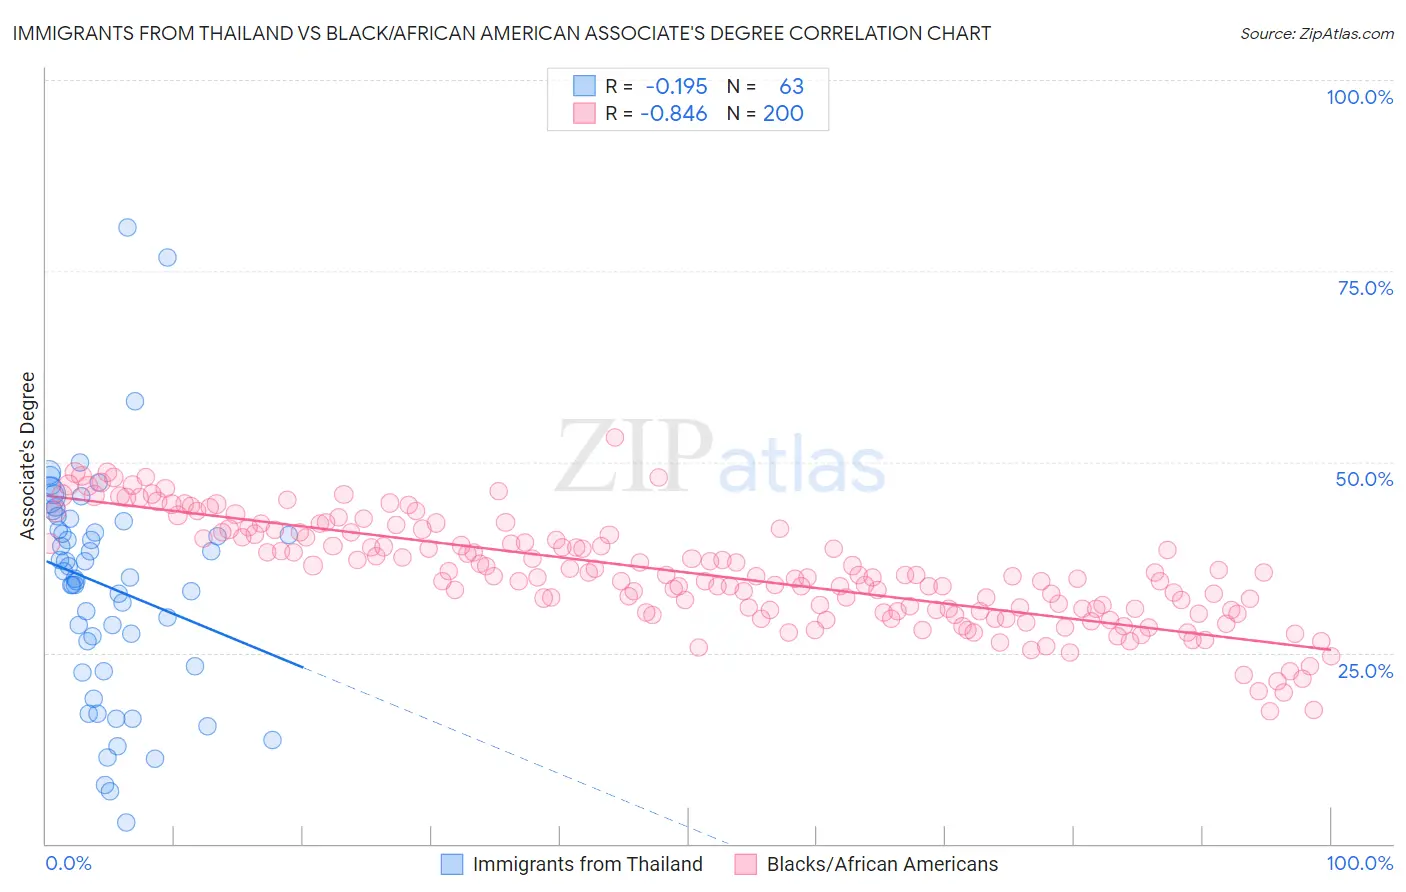
Immigrants from Thailand vs Black/African American Associate's Degree Correlation Chart
The statistical analysis conducted on geographies consisting of 317,008,918 people shows a poor negative correlation between the proportion of Immigrants from Thailand and percentage of population with at least associate's degree education in the United States with a correlation coefficient (R) of -0.195 and weighted average of 45.1%. Similarly, the statistical analysis conducted on geographies consisting of 565,941,999 people shows a very strong negative correlation between the proportion of Blacks/African Americans and percentage of population with at least associate's degree education in the United States with a correlation coefficient (R) of -0.846 and weighted average of 39.1%, a difference of 15.2%.
Associate's Degree Correlation Summary
| Measurement | Immigrants from Thailand | Black/African American |
| Minimum | 2.7% | 17.4% |
| Maximum | 80.6% | 53.2% |
| Range | 77.9% | 35.8% |
| Mean | 33.8% | 35.5% |
| Median | 34.9% | 35.1% |
| Interquartile 25% (IQ1) | 23.3% | 30.6% |
| Interquartile 75% (IQ3) | 42.3% | 40.7% |
| Interquartile Range (IQR) | 19.0% | 10.1% |
| Standard Deviation (Sample) | 14.7% | 6.9% |
| Standard Deviation (Population) | 14.6% | 6.9% |
Similar Demographics by Associate's Degree
Demographics Similar to Immigrants from Thailand by Associate's Degree
In terms of associate's degree, the demographic groups most similar to Immigrants from Thailand are German Russian (45.1%, a difference of 0.0%), Nigerian (45.1%, a difference of 0.020%), Panamanian (45.1%, a difference of 0.070%), Immigrants from South Eastern Asia (45.2%, a difference of 0.16%), and Dutch (45.0%, a difference of 0.17%).
| Demographics | Rating | Rank | Associate's Degree |
| Immigrants | Bangladesh | 21.3 /100 | #198 | Fair 45.2% |
| Immigrants | Senegal | 21.2 /100 | #199 | Fair 45.2% |
| Senegalese | 21.1 /100 | #200 | Fair 45.2% |
| Immigrants | Vietnam | 20.8 /100 | #201 | Fair 45.2% |
| Spaniards | 20.4 /100 | #202 | Fair 45.2% |
| Immigrants | South Eastern Asia | 20.2 /100 | #203 | Fair 45.2% |
| Nigerians | 19.1 /100 | #204 | Poor 45.1% |
| Immigrants | Thailand | 18.9 /100 | #205 | Poor 45.1% |
| German Russians | 18.9 /100 | #206 | Poor 45.1% |
| Panamanians | 18.4 /100 | #207 | Poor 45.1% |
| Dutch | 17.6 /100 | #208 | Poor 45.0% |
| Immigrants | Costa Rica | 16.7 /100 | #209 | Poor 45.0% |
| Immigrants | Philippines | 16.7 /100 | #210 | Poor 45.0% |
| Immigrants | Zaire | 16.6 /100 | #211 | Poor 45.0% |
| French Canadians | 15.0 /100 | #212 | Poor 44.9% |
Demographics Similar to Blacks/African Americans by Associate's Degree
In terms of associate's degree, the demographic groups most similar to Blacks/African Americans are Nepalese (39.0%, a difference of 0.25%), Salvadoran (39.0%, a difference of 0.25%), Dominican (39.3%, a difference of 0.29%), Immigrants from Haiti (39.3%, a difference of 0.30%), and Honduran (38.9%, a difference of 0.54%).
| Demographics | Rating | Rank | Associate's Degree |
| Immigrants | Belize | 0.1 /100 | #285 | Tragic 39.9% |
| Immigrants | Caribbean | 0.0 /100 | #286 | Tragic 39.7% |
| Aleuts | 0.0 /100 | #287 | Tragic 39.6% |
| Immigrants | Cuba | 0.0 /100 | #288 | Tragic 39.5% |
| Central Americans | 0.0 /100 | #289 | Tragic 39.4% |
| Immigrants | Haiti | 0.0 /100 | #290 | Tragic 39.3% |
| Dominicans | 0.0 /100 | #291 | Tragic 39.3% |
| Blacks/African Americans | 0.0 /100 | #292 | Tragic 39.1% |
| Nepalese | 0.0 /100 | #293 | Tragic 39.0% |
| Salvadorans | 0.0 /100 | #294 | Tragic 39.0% |
| Hondurans | 0.0 /100 | #295 | Tragic 38.9% |
| Cherokee | 0.0 /100 | #296 | Tragic 38.9% |
| Cape Verdeans | 0.0 /100 | #297 | Tragic 38.8% |
| Cheyenne | 0.0 /100 | #298 | Tragic 38.7% |
| Ute | 0.0 /100 | #299 | Tragic 38.6% |