Immigrants from Kazakhstan vs Black/African American Associate's Degree
COMPARE
Immigrants from Kazakhstan
Black/African American
Associate's Degree
Associate's Degree Comparison
Immigrants from Kazakhstan
Blacks/African Americans
51.4%
ASSOCIATE'S DEGREE
99.7/ 100
METRIC RATING
61st/ 347
METRIC RANK
39.1%
ASSOCIATE'S DEGREE
0.0/ 100
METRIC RATING
292nd/ 347
METRIC RANK
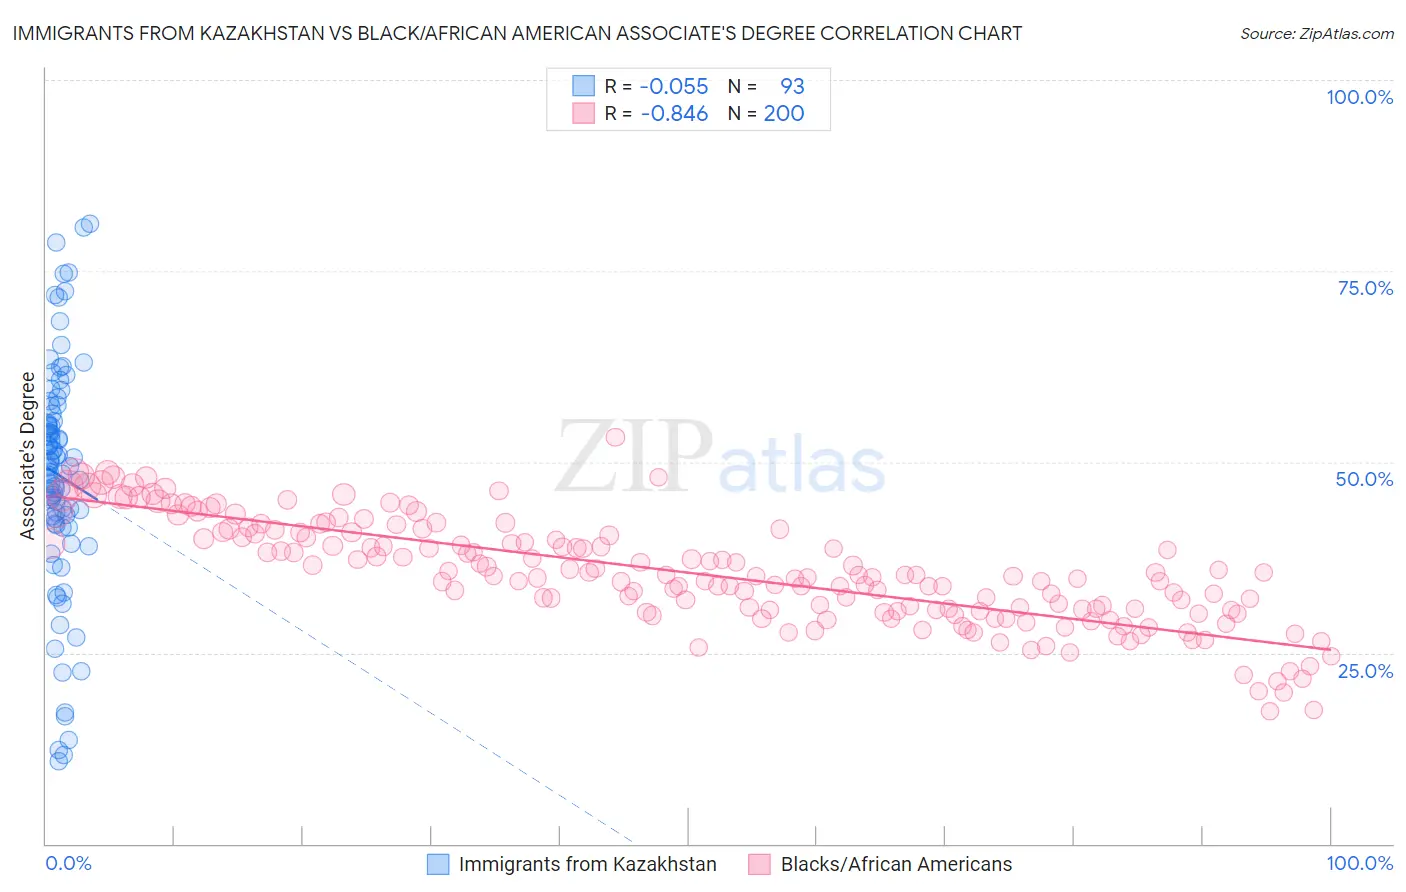
Immigrants from Kazakhstan vs Black/African American Associate's Degree Correlation Chart
The statistical analysis conducted on geographies consisting of 124,444,388 people shows a slight negative correlation between the proportion of Immigrants from Kazakhstan and percentage of population with at least associate's degree education in the United States with a correlation coefficient (R) of -0.055 and weighted average of 51.4%. Similarly, the statistical analysis conducted on geographies consisting of 565,941,999 people shows a very strong negative correlation between the proportion of Blacks/African Americans and percentage of population with at least associate's degree education in the United States with a correlation coefficient (R) of -0.846 and weighted average of 39.1%, a difference of 31.4%.
Associate's Degree Correlation Summary
| Measurement | Immigrants from Kazakhstan | Black/African American |
| Minimum | 10.8% | 17.4% |
| Maximum | 81.2% | 53.2% |
| Range | 70.3% | 35.8% |
| Mean | 48.3% | 35.5% |
| Median | 49.4% | 35.1% |
| Interquartile 25% (IQ1) | 41.8% | 30.6% |
| Interquartile 75% (IQ3) | 56.8% | 40.7% |
| Interquartile Range (IQR) | 15.0% | 10.1% |
| Standard Deviation (Sample) | 15.2% | 6.9% |
| Standard Deviation (Population) | 15.1% | 6.9% |
Similar Demographics by Associate's Degree
Demographics Similar to Immigrants from Kazakhstan by Associate's Degree
In terms of associate's degree, the demographic groups most similar to Immigrants from Kazakhstan are Bhutanese (51.4%, a difference of 0.0%), South African (51.4%, a difference of 0.060%), Immigrants from Netherlands (51.4%, a difference of 0.13%), Immigrants from Bolivia (51.5%, a difference of 0.15%), and Zimbabwean (51.3%, a difference of 0.16%).
| Demographics | Rating | Rank | Associate's Degree |
| Immigrants | Spain | 99.8 /100 | #54 | Exceptional 51.9% |
| Australians | 99.8 /100 | #55 | Exceptional 51.9% |
| Immigrants | Czechoslovakia | 99.8 /100 | #56 | Exceptional 51.9% |
| Paraguayans | 99.8 /100 | #57 | Exceptional 51.8% |
| New Zealanders | 99.8 /100 | #58 | Exceptional 51.8% |
| Immigrants | Serbia | 99.8 /100 | #59 | Exceptional 51.7% |
| Immigrants | Bolivia | 99.7 /100 | #60 | Exceptional 51.5% |
| Immigrants | Kazakhstan | 99.7 /100 | #61 | Exceptional 51.4% |
| Bhutanese | 99.7 /100 | #62 | Exceptional 51.4% |
| South Africans | 99.7 /100 | #63 | Exceptional 51.4% |
| Immigrants | Netherlands | 99.7 /100 | #64 | Exceptional 51.4% |
| Zimbabweans | 99.7 /100 | #65 | Exceptional 51.3% |
| Immigrants | Europe | 99.7 /100 | #66 | Exceptional 51.3% |
| Argentineans | 99.6 /100 | #67 | Exceptional 51.2% |
| Immigrants | Indonesia | 99.5 /100 | #68 | Exceptional 51.0% |
Demographics Similar to Blacks/African Americans by Associate's Degree
In terms of associate's degree, the demographic groups most similar to Blacks/African Americans are Nepalese (39.0%, a difference of 0.25%), Salvadoran (39.0%, a difference of 0.25%), Dominican (39.3%, a difference of 0.29%), Immigrants from Haiti (39.3%, a difference of 0.30%), and Honduran (38.9%, a difference of 0.54%).
| Demographics | Rating | Rank | Associate's Degree |
| Immigrants | Belize | 0.1 /100 | #285 | Tragic 39.9% |
| Immigrants | Caribbean | 0.0 /100 | #286 | Tragic 39.7% |
| Aleuts | 0.0 /100 | #287 | Tragic 39.6% |
| Immigrants | Cuba | 0.0 /100 | #288 | Tragic 39.5% |
| Central Americans | 0.0 /100 | #289 | Tragic 39.4% |
| Immigrants | Haiti | 0.0 /100 | #290 | Tragic 39.3% |
| Dominicans | 0.0 /100 | #291 | Tragic 39.3% |
| Blacks/African Americans | 0.0 /100 | #292 | Tragic 39.1% |
| Nepalese | 0.0 /100 | #293 | Tragic 39.0% |
| Salvadorans | 0.0 /100 | #294 | Tragic 39.0% |
| Hondurans | 0.0 /100 | #295 | Tragic 38.9% |
| Cherokee | 0.0 /100 | #296 | Tragic 38.9% |
| Cape Verdeans | 0.0 /100 | #297 | Tragic 38.8% |
| Cheyenne | 0.0 /100 | #298 | Tragic 38.7% |
| Ute | 0.0 /100 | #299 | Tragic 38.6% |