Yaqui vs Immigrants from Oceania Associate's Degree
COMPARE
Yaqui
Immigrants from Oceania
Associate's Degree
Associate's Degree Comparison
Yaqui
Immigrants from Oceania
37.6%
ASSOCIATE'S DEGREE
0.0/ 100
METRIC RATING
317th/ 347
METRIC RANK
45.8%
ASSOCIATE'S DEGREE
34.7/ 100
METRIC RATING
189th/ 347
METRIC RANK
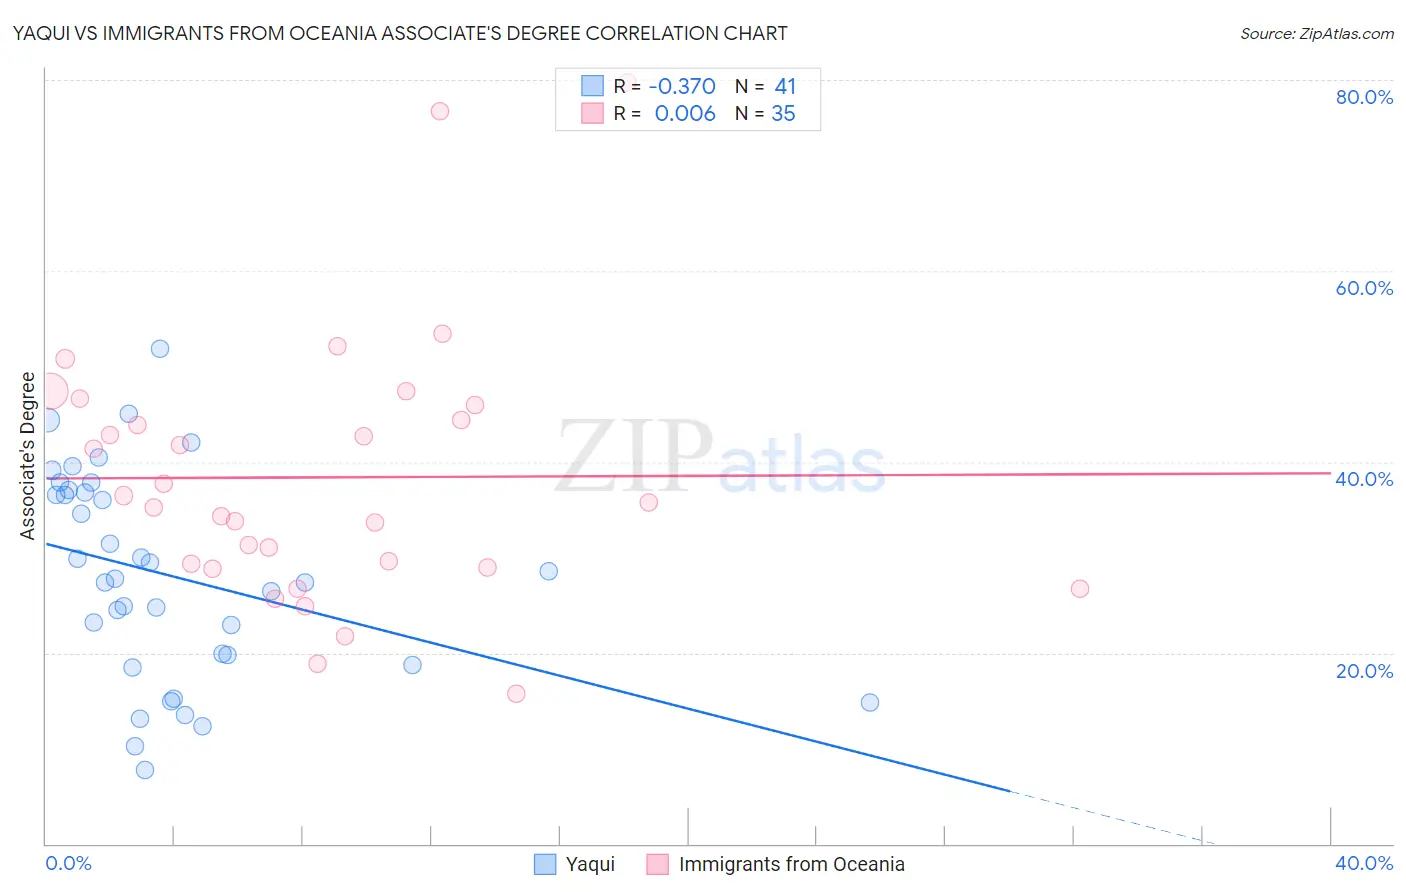
Yaqui vs Immigrants from Oceania Associate's Degree Correlation Chart
The statistical analysis conducted on geographies consisting of 107,738,640 people shows a mild negative correlation between the proportion of Yaqui and percentage of population with at least associate's degree education in the United States with a correlation coefficient (R) of -0.370 and weighted average of 37.6%. Similarly, the statistical analysis conducted on geographies consisting of 305,516,094 people shows no correlation between the proportion of Immigrants from Oceania and percentage of population with at least associate's degree education in the United States with a correlation coefficient (R) of 0.006 and weighted average of 45.8%, a difference of 22.0%.
Associate's Degree Correlation Summary
| Measurement | Yaqui | Immigrants from Oceania |
| Minimum | 7.7% | 15.7% |
| Maximum | 51.9% | 79.8% |
| Range | 44.1% | 64.1% |
| Mean | 28.1% | 38.4% |
| Median | 27.8% | 35.7% |
| Interquartile 25% (IQ1) | 19.2% | 28.9% |
| Interquartile 75% (IQ3) | 36.9% | 46.0% |
| Interquartile Range (IQR) | 17.7% | 17.0% |
| Standard Deviation (Sample) | 10.8% | 13.8% |
| Standard Deviation (Population) | 10.7% | 13.6% |
Similar Demographics by Associate's Degree
Demographics Similar to Yaqui by Associate's Degree
In terms of associate's degree, the demographic groups most similar to Yaqui are Creek (37.6%, a difference of 0.020%), Crow (37.6%, a difference of 0.020%), Alaska Native (37.5%, a difference of 0.23%), Seminole (37.7%, a difference of 0.41%), and Fijian (37.4%, a difference of 0.45%).
| Demographics | Rating | Rank | Associate's Degree |
| Immigrants | Dominican Republic | 0.0 /100 | #310 | Tragic 37.9% |
| Immigrants | Latin America | 0.0 /100 | #311 | Tragic 37.9% |
| Choctaw | 0.0 /100 | #312 | Tragic 37.8% |
| Hispanics or Latinos | 0.0 /100 | #313 | Tragic 37.7% |
| Seminole | 0.0 /100 | #314 | Tragic 37.7% |
| Creek | 0.0 /100 | #315 | Tragic 37.6% |
| Crow | 0.0 /100 | #316 | Tragic 37.6% |
| Yaqui | 0.0 /100 | #317 | Tragic 37.6% |
| Alaska Natives | 0.0 /100 | #318 | Tragic 37.5% |
| Fijians | 0.0 /100 | #319 | Tragic 37.4% |
| Cajuns | 0.0 /100 | #320 | Tragic 37.4% |
| Immigrants | Yemen | 0.0 /100 | #321 | Tragic 37.3% |
| Pennsylvania Germans | 0.0 /100 | #322 | Tragic 37.2% |
| Immigrants | Cabo Verde | 0.0 /100 | #323 | Tragic 36.8% |
| Arapaho | 0.0 /100 | #324 | Tragic 36.7% |
Demographics Similar to Immigrants from Oceania by Associate's Degree
In terms of associate's degree, the demographic groups most similar to Immigrants from Oceania are Immigrants from Uruguay (45.8%, a difference of 0.060%), Ghanaian (45.8%, a difference of 0.060%), Vietnamese (45.8%, a difference of 0.060%), Korean (45.8%, a difference of 0.070%), and Celtic (45.8%, a difference of 0.12%).
| Demographics | Rating | Rank | Associate's Degree |
| Swiss | 40.4 /100 | #182 | Average 46.0% |
| Yugoslavians | 40.2 /100 | #183 | Average 46.0% |
| Czechoslovakians | 40.0 /100 | #184 | Average 46.0% |
| Costa Ricans | 38.6 /100 | #185 | Fair 46.0% |
| Welsh | 37.9 /100 | #186 | Fair 45.9% |
| Immigrants | Uruguay | 35.5 /100 | #187 | Fair 45.8% |
| Ghanaians | 35.5 /100 | #188 | Fair 45.8% |
| Immigrants | Oceania | 34.7 /100 | #189 | Fair 45.8% |
| Vietnamese | 34.0 /100 | #190 | Fair 45.8% |
| Koreans | 33.8 /100 | #191 | Fair 45.8% |
| Celtics | 33.3 /100 | #192 | Fair 45.8% |
| Immigrants | Cameroon | 31.0 /100 | #193 | Fair 45.7% |
| Immigrants | Peru | 27.6 /100 | #194 | Fair 45.5% |
| Germans | 26.5 /100 | #195 | Fair 45.5% |
| French | 25.6 /100 | #196 | Fair 45.4% |