Costa Rican vs Black/African American Associate's Degree
COMPARE
Costa Rican
Black/African American
Associate's Degree
Associate's Degree Comparison
Costa Ricans
Blacks/African Americans
46.0%
ASSOCIATE'S DEGREE
38.6/ 100
METRIC RATING
185th/ 347
METRIC RANK
39.1%
ASSOCIATE'S DEGREE
0.0/ 100
METRIC RATING
292nd/ 347
METRIC RANK
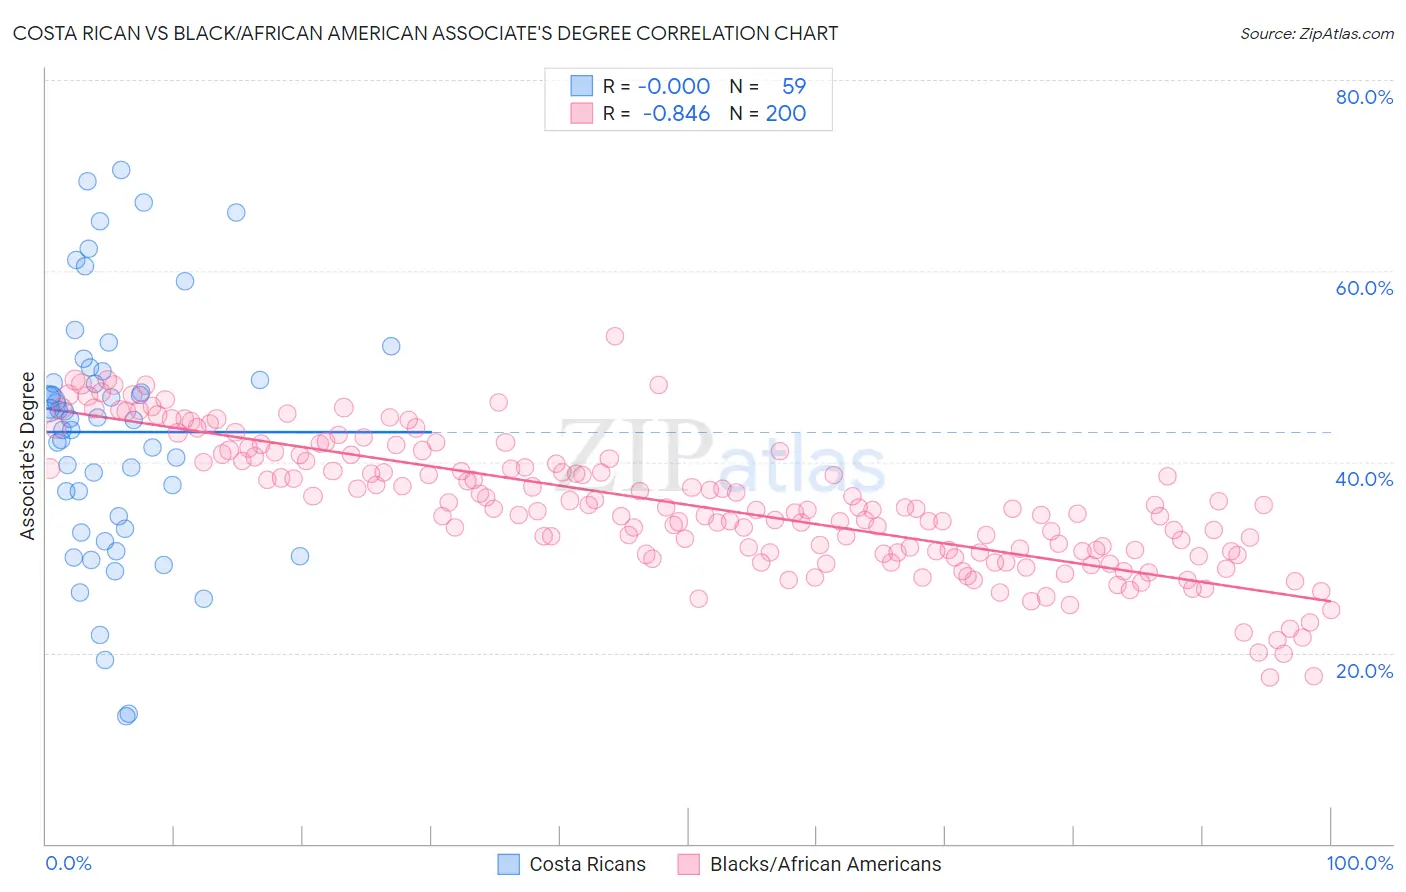
Costa Rican vs Black/African American Associate's Degree Correlation Chart
The statistical analysis conducted on geographies consisting of 253,596,799 people shows no correlation between the proportion of Costa Ricans and percentage of population with at least associate's degree education in the United States with a correlation coefficient (R) of -0.000 and weighted average of 46.0%. Similarly, the statistical analysis conducted on geographies consisting of 565,941,999 people shows a very strong negative correlation between the proportion of Blacks/African Americans and percentage of population with at least associate's degree education in the United States with a correlation coefficient (R) of -0.846 and weighted average of 39.1%, a difference of 17.4%.
Associate's Degree Correlation Summary
| Measurement | Costa Rican | Black/African American |
| Minimum | 13.4% | 17.4% |
| Maximum | 70.5% | 53.2% |
| Range | 57.2% | 35.8% |
| Mean | 43.1% | 35.5% |
| Median | 44.5% | 35.1% |
| Interquartile 25% (IQ1) | 33.0% | 30.6% |
| Interquartile 75% (IQ3) | 49.5% | 40.7% |
| Interquartile Range (IQR) | 16.5% | 10.1% |
| Standard Deviation (Sample) | 13.1% | 6.9% |
| Standard Deviation (Population) | 13.0% | 6.9% |
Similar Demographics by Associate's Degree
Demographics Similar to Costa Ricans by Associate's Degree
In terms of associate's degree, the demographic groups most similar to Costa Ricans are Welsh (45.9%, a difference of 0.060%), Czechoslovakian (46.0%, a difference of 0.11%), Yugoslavian (46.0%, a difference of 0.13%), Swiss (46.0%, a difference of 0.14%), and Immigrants from Colombia (46.0%, a difference of 0.21%).
| Demographics | Rating | Rank | Associate's Degree |
| Immigrants | Bosnia and Herzegovina | 48.3 /100 | #178 | Average 46.3% |
| Sri Lankans | 47.6 /100 | #179 | Average 46.3% |
| Bermudans | 46.4 /100 | #180 | Average 46.2% |
| Immigrants | Colombia | 41.3 /100 | #181 | Average 46.0% |
| Swiss | 40.4 /100 | #182 | Average 46.0% |
| Yugoslavians | 40.2 /100 | #183 | Average 46.0% |
| Czechoslovakians | 40.0 /100 | #184 | Average 46.0% |
| Costa Ricans | 38.6 /100 | #185 | Fair 46.0% |
| Welsh | 37.9 /100 | #186 | Fair 45.9% |
| Immigrants | Uruguay | 35.5 /100 | #187 | Fair 45.8% |
| Ghanaians | 35.5 /100 | #188 | Fair 45.8% |
| Immigrants | Oceania | 34.7 /100 | #189 | Fair 45.8% |
| Vietnamese | 34.0 /100 | #190 | Fair 45.8% |
| Koreans | 33.8 /100 | #191 | Fair 45.8% |
| Celtics | 33.3 /100 | #192 | Fair 45.8% |
Demographics Similar to Blacks/African Americans by Associate's Degree
In terms of associate's degree, the demographic groups most similar to Blacks/African Americans are Nepalese (39.0%, a difference of 0.25%), Salvadoran (39.0%, a difference of 0.25%), Dominican (39.3%, a difference of 0.29%), Immigrants from Haiti (39.3%, a difference of 0.30%), and Honduran (38.9%, a difference of 0.54%).
| Demographics | Rating | Rank | Associate's Degree |
| Immigrants | Belize | 0.1 /100 | #285 | Tragic 39.9% |
| Immigrants | Caribbean | 0.0 /100 | #286 | Tragic 39.7% |
| Aleuts | 0.0 /100 | #287 | Tragic 39.6% |
| Immigrants | Cuba | 0.0 /100 | #288 | Tragic 39.5% |
| Central Americans | 0.0 /100 | #289 | Tragic 39.4% |
| Immigrants | Haiti | 0.0 /100 | #290 | Tragic 39.3% |
| Dominicans | 0.0 /100 | #291 | Tragic 39.3% |
| Blacks/African Americans | 0.0 /100 | #292 | Tragic 39.1% |
| Nepalese | 0.0 /100 | #293 | Tragic 39.0% |
| Salvadorans | 0.0 /100 | #294 | Tragic 39.0% |
| Hondurans | 0.0 /100 | #295 | Tragic 38.9% |
| Cherokee | 0.0 /100 | #296 | Tragic 38.9% |
| Cape Verdeans | 0.0 /100 | #297 | Tragic 38.8% |
| Cheyenne | 0.0 /100 | #298 | Tragic 38.7% |
| Ute | 0.0 /100 | #299 | Tragic 38.6% |