Yaqui vs Immigrants from Spain Associate's Degree
COMPARE
Yaqui
Immigrants from Spain
Associate's Degree
Associate's Degree Comparison
Yaqui
Immigrants from Spain
37.6%
ASSOCIATE'S DEGREE
0.0/ 100
METRIC RATING
317th/ 347
METRIC RANK
51.9%
ASSOCIATE'S DEGREE
99.8/ 100
METRIC RATING
54th/ 347
METRIC RANK
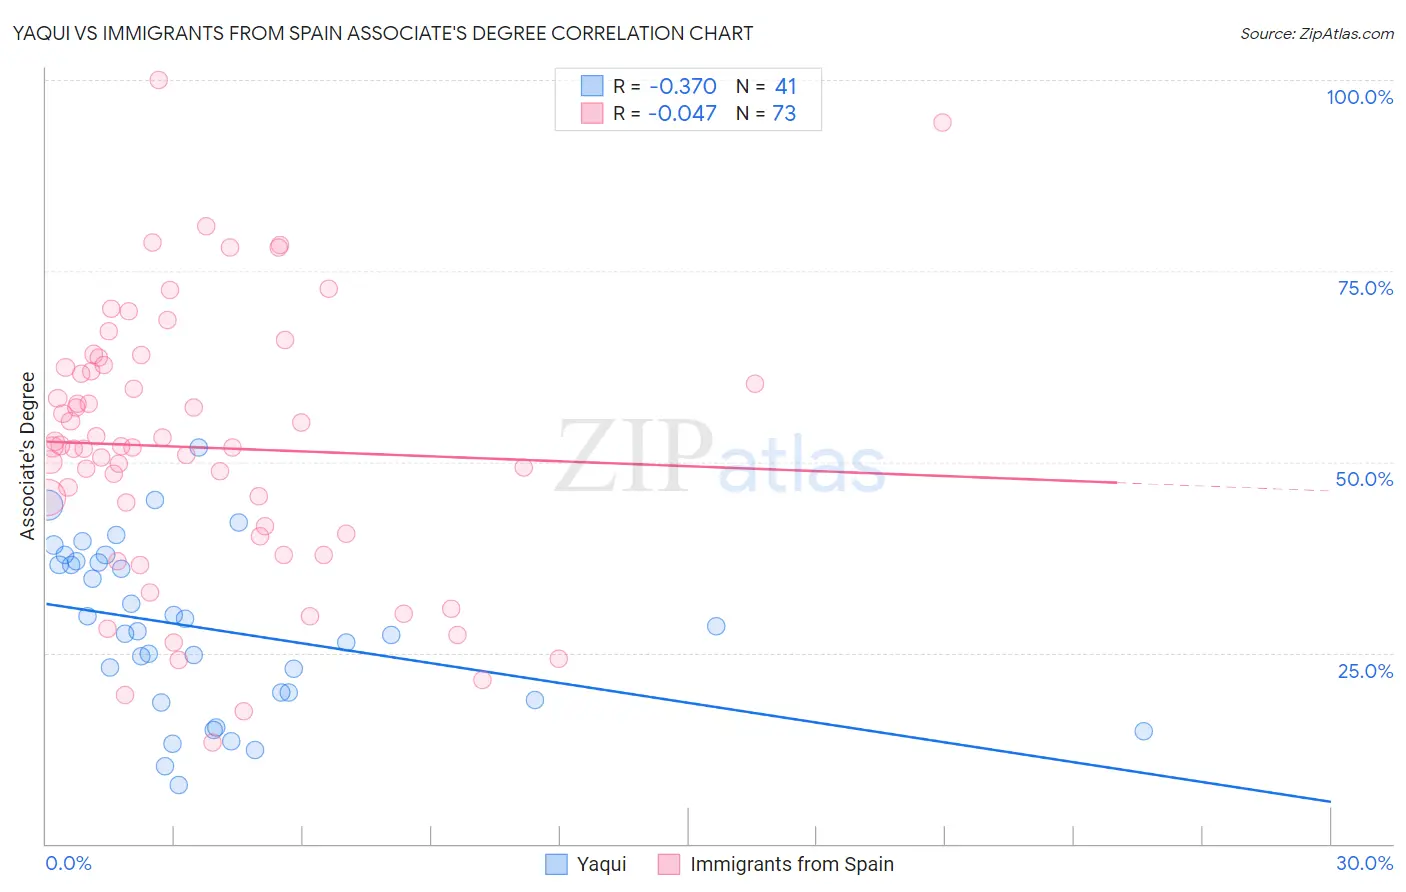
Yaqui vs Immigrants from Spain Associate's Degree Correlation Chart
The statistical analysis conducted on geographies consisting of 107,738,640 people shows a mild negative correlation between the proportion of Yaqui and percentage of population with at least associate's degree education in the United States with a correlation coefficient (R) of -0.370 and weighted average of 37.6%. Similarly, the statistical analysis conducted on geographies consisting of 239,681,023 people shows no correlation between the proportion of Immigrants from Spain and percentage of population with at least associate's degree education in the United States with a correlation coefficient (R) of -0.047 and weighted average of 51.9%, a difference of 38.2%.
Associate's Degree Correlation Summary
| Measurement | Yaqui | Immigrants from Spain |
| Minimum | 7.7% | 13.3% |
| Maximum | 51.9% | 100.0% |
| Range | 44.1% | 86.7% |
| Mean | 28.1% | 51.9% |
| Median | 27.8% | 52.0% |
| Interquartile 25% (IQ1) | 19.2% | 40.4% |
| Interquartile 75% (IQ3) | 36.9% | 62.6% |
| Interquartile Range (IQR) | 17.7% | 22.2% |
| Standard Deviation (Sample) | 10.8% | 17.6% |
| Standard Deviation (Population) | 10.7% | 17.5% |
Similar Demographics by Associate's Degree
Demographics Similar to Yaqui by Associate's Degree
In terms of associate's degree, the demographic groups most similar to Yaqui are Creek (37.6%, a difference of 0.020%), Crow (37.6%, a difference of 0.020%), Alaska Native (37.5%, a difference of 0.23%), Seminole (37.7%, a difference of 0.41%), and Fijian (37.4%, a difference of 0.45%).
| Demographics | Rating | Rank | Associate's Degree |
| Immigrants | Dominican Republic | 0.0 /100 | #310 | Tragic 37.9% |
| Immigrants | Latin America | 0.0 /100 | #311 | Tragic 37.9% |
| Choctaw | 0.0 /100 | #312 | Tragic 37.8% |
| Hispanics or Latinos | 0.0 /100 | #313 | Tragic 37.7% |
| Seminole | 0.0 /100 | #314 | Tragic 37.7% |
| Creek | 0.0 /100 | #315 | Tragic 37.6% |
| Crow | 0.0 /100 | #316 | Tragic 37.6% |
| Yaqui | 0.0 /100 | #317 | Tragic 37.6% |
| Alaska Natives | 0.0 /100 | #318 | Tragic 37.5% |
| Fijians | 0.0 /100 | #319 | Tragic 37.4% |
| Cajuns | 0.0 /100 | #320 | Tragic 37.4% |
| Immigrants | Yemen | 0.0 /100 | #321 | Tragic 37.3% |
| Pennsylvania Germans | 0.0 /100 | #322 | Tragic 37.2% |
| Immigrants | Cabo Verde | 0.0 /100 | #323 | Tragic 36.8% |
| Arapaho | 0.0 /100 | #324 | Tragic 36.7% |
Demographics Similar to Immigrants from Spain by Associate's Degree
In terms of associate's degree, the demographic groups most similar to Immigrants from Spain are Australian (51.9%, a difference of 0.030%), Immigrants from Czechoslovakia (51.9%, a difference of 0.050%), Immigrants from Asia (52.0%, a difference of 0.10%), Bolivian (52.0%, a difference of 0.13%), and Paraguayan (51.8%, a difference of 0.17%).
| Demographics | Rating | Rank | Associate's Degree |
| Immigrants | Kuwait | 99.9 /100 | #47 | Exceptional 52.4% |
| Immigrants | Norway | 99.9 /100 | #48 | Exceptional 52.2% |
| Immigrants | Austria | 99.9 /100 | #49 | Exceptional 52.1% |
| Asians | 99.9 /100 | #50 | Exceptional 52.1% |
| Immigrants | Greece | 99.9 /100 | #51 | Exceptional 52.1% |
| Bolivians | 99.8 /100 | #52 | Exceptional 52.0% |
| Immigrants | Asia | 99.8 /100 | #53 | Exceptional 52.0% |
| Immigrants | Spain | 99.8 /100 | #54 | Exceptional 51.9% |
| Australians | 99.8 /100 | #55 | Exceptional 51.9% |
| Immigrants | Czechoslovakia | 99.8 /100 | #56 | Exceptional 51.9% |
| Paraguayans | 99.8 /100 | #57 | Exceptional 51.8% |
| New Zealanders | 99.8 /100 | #58 | Exceptional 51.8% |
| Immigrants | Serbia | 99.8 /100 | #59 | Exceptional 51.7% |
| Immigrants | Bolivia | 99.7 /100 | #60 | Exceptional 51.5% |
| Immigrants | Kazakhstan | 99.7 /100 | #61 | Exceptional 51.4% |