Filipino vs Uruguayan College, 1 year or more
COMPARE
Filipino
Uruguayan
College, 1 year or more
College, 1 year or more Comparison
Filipinos
Uruguayans
71.0%
COLLEGE, 1 YEAR OR MORE
100.0/ 100
METRIC RATING
1st/ 347
METRIC RANK
58.8%
COLLEGE, 1 YEAR OR MORE
31.8/ 100
METRIC RATING
189th/ 347
METRIC RANK
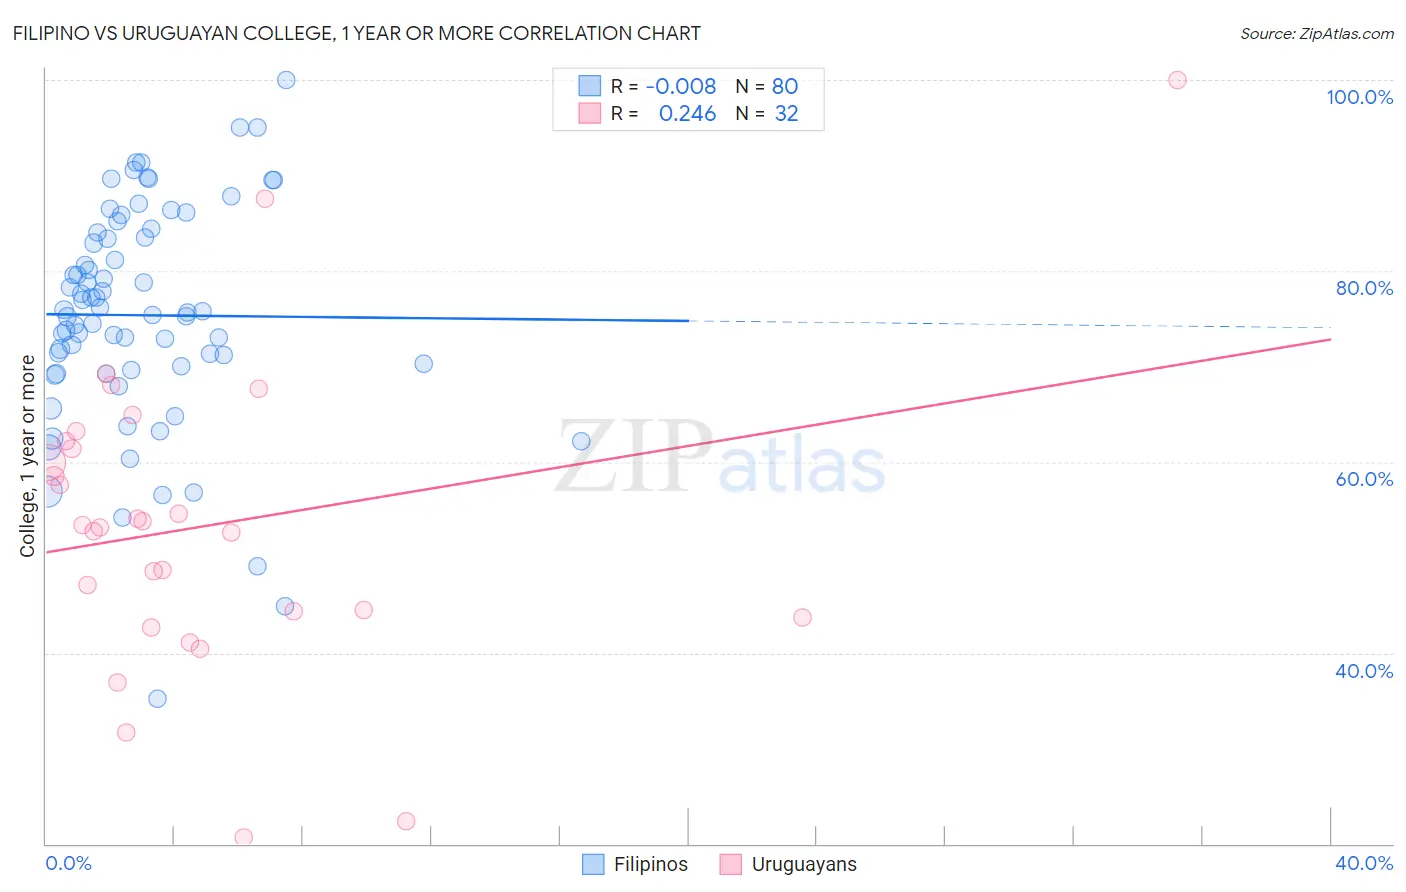
Filipino vs Uruguayan College, 1 year or more Correlation Chart
The statistical analysis conducted on geographies consisting of 254,347,704 people shows no correlation between the proportion of Filipinos and percentage of population with at least college, 1 year or more education in the United States with a correlation coefficient (R) of -0.008 and weighted average of 71.0%. Similarly, the statistical analysis conducted on geographies consisting of 144,782,794 people shows a weak positive correlation between the proportion of Uruguayans and percentage of population with at least college, 1 year or more education in the United States with a correlation coefficient (R) of 0.246 and weighted average of 58.8%, a difference of 20.7%.
College, 1 year or more Correlation Summary
| Measurement | Filipino | Uruguayan |
| Minimum | 35.1% | 20.6% |
| Maximum | 100.0% | 100.0% |
| Range | 64.9% | 79.4% |
| Mean | 75.4% | 53.3% |
| Median | 75.7% | 53.2% |
| Interquartile 25% (IQ1) | 69.8% | 44.0% |
| Interquartile 75% (IQ3) | 83.8% | 61.8% |
| Interquartile Range (IQR) | 13.9% | 17.8% |
| Standard Deviation (Sample) | 11.7% | 16.1% |
| Standard Deviation (Population) | 11.7% | 15.8% |
Similar Demographics by College, 1 year or more
Demographics Similar to Filipinos by College, 1 year or more
In terms of college, 1 year or more, the demographic groups most similar to Filipinos are Immigrants from Singapore (70.1%, a difference of 1.2%), Iranian (70.0%, a difference of 1.4%), Immigrants from Taiwan (69.6%, a difference of 1.9%), Immigrants from India (69.6%, a difference of 1.9%), and Immigrants from Iran (69.5%, a difference of 2.1%).
| Demographics | Rating | Rank | College, 1 year or more |
| Filipinos | 100.0 /100 | #1 | Exceptional 71.0% |
| Immigrants | Singapore | 100.0 /100 | #2 | Exceptional 70.1% |
| Iranians | 100.0 /100 | #3 | Exceptional 70.0% |
| Immigrants | Taiwan | 100.0 /100 | #4 | Exceptional 69.6% |
| Immigrants | India | 100.0 /100 | #5 | Exceptional 69.6% |
| Immigrants | Iran | 100.0 /100 | #6 | Exceptional 69.5% |
| Okinawans | 100.0 /100 | #7 | Exceptional 69.0% |
| Thais | 100.0 /100 | #8 | Exceptional 68.6% |
| Immigrants | Israel | 100.0 /100 | #9 | Exceptional 67.8% |
| Immigrants | Australia | 100.0 /100 | #10 | Exceptional 67.7% |
| Immigrants | South Central Asia | 100.0 /100 | #11 | Exceptional 67.1% |
| Cypriots | 100.0 /100 | #12 | Exceptional 67.0% |
| Immigrants | Sweden | 100.0 /100 | #13 | Exceptional 66.8% |
| Burmese | 100.0 /100 | #14 | Exceptional 66.7% |
| Cambodians | 100.0 /100 | #15 | Exceptional 66.7% |
Demographics Similar to Uruguayans by College, 1 year or more
In terms of college, 1 year or more, the demographic groups most similar to Uruguayans are Immigrants from Cameroon (58.8%, a difference of 0.040%), French (58.9%, a difference of 0.15%), German (58.9%, a difference of 0.17%), Immigrants from Philippines (58.7%, a difference of 0.17%), and Scotch-Irish (58.9%, a difference of 0.18%).
| Demographics | Rating | Rank | College, 1 year or more |
| Immigrants | Bosnia and Herzegovina | 42.8 /100 | #182 | Average 59.2% |
| German Russians | 39.3 /100 | #183 | Fair 59.1% |
| Spaniards | 38.3 /100 | #184 | Fair 59.0% |
| South Americans | 35.9 /100 | #185 | Fair 59.0% |
| Scotch-Irish | 34.7 /100 | #186 | Fair 58.9% |
| Germans | 34.7 /100 | #187 | Fair 58.9% |
| French | 34.4 /100 | #188 | Fair 58.9% |
| Uruguayans | 31.8 /100 | #189 | Fair 58.8% |
| Immigrants | Cameroon | 31.2 /100 | #190 | Fair 58.8% |
| Immigrants | Philippines | 29.2 /100 | #191 | Fair 58.7% |
| Colombians | 27.6 /100 | #192 | Fair 58.7% |
| Peruvians | 27.5 /100 | #193 | Fair 58.6% |
| Costa Ricans | 26.4 /100 | #194 | Fair 58.6% |
| Dutch | 26.2 /100 | #195 | Fair 58.6% |
| Guamanians/Chamorros | 26.2 /100 | #196 | Fair 58.6% |