Mongolian vs Uruguayan College, 1 year or more
COMPARE
Mongolian
Uruguayan
College, 1 year or more
College, 1 year or more Comparison
Mongolians
Uruguayans
64.8%
COLLEGE, 1 YEAR OR MORE
99.9/ 100
METRIC RATING
41st/ 347
METRIC RANK
58.8%
COLLEGE, 1 YEAR OR MORE
31.8/ 100
METRIC RATING
189th/ 347
METRIC RANK
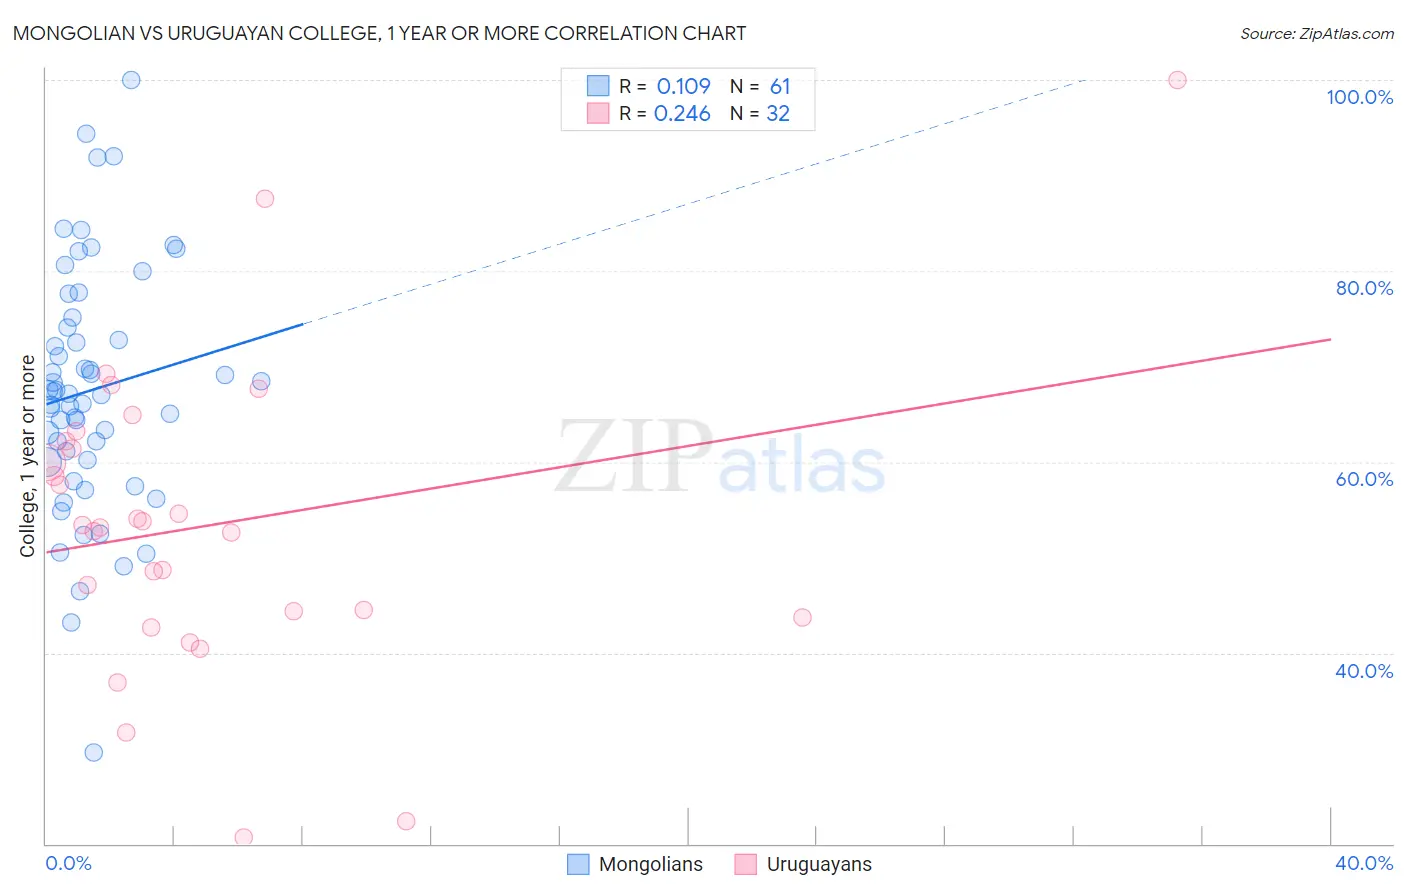
Mongolian vs Uruguayan College, 1 year or more Correlation Chart
The statistical analysis conducted on geographies consisting of 140,362,004 people shows a poor positive correlation between the proportion of Mongolians and percentage of population with at least college, 1 year or more education in the United States with a correlation coefficient (R) of 0.109 and weighted average of 64.8%. Similarly, the statistical analysis conducted on geographies consisting of 144,782,794 people shows a weak positive correlation between the proportion of Uruguayans and percentage of population with at least college, 1 year or more education in the United States with a correlation coefficient (R) of 0.246 and weighted average of 58.8%, a difference of 10.2%.
College, 1 year or more Correlation Summary
| Measurement | Mongolian | Uruguayan |
| Minimum | 29.5% | 20.6% |
| Maximum | 100.0% | 100.0% |
| Range | 70.5% | 79.4% |
| Mean | 67.5% | 53.3% |
| Median | 67.1% | 53.2% |
| Interquartile 25% (IQ1) | 60.1% | 44.0% |
| Interquartile 75% (IQ3) | 74.6% | 61.8% |
| Interquartile Range (IQR) | 14.5% | 17.8% |
| Standard Deviation (Sample) | 12.9% | 16.1% |
| Standard Deviation (Population) | 12.8% | 15.8% |
Similar Demographics by College, 1 year or more
Demographics Similar to Mongolians by College, 1 year or more
In terms of college, 1 year or more, the demographic groups most similar to Mongolians are Immigrants from Latvia (64.8%, a difference of 0.010%), Immigrants from Russia (64.7%, a difference of 0.13%), Immigrants from Norway (64.7%, a difference of 0.15%), Immigrants from Kuwait (65.0%, a difference of 0.20%), and Estonian (65.0%, a difference of 0.26%).
| Demographics | Rating | Rank | College, 1 year or more |
| Israelis | 99.9 /100 | #34 | Exceptional 65.3% |
| Immigrants | Turkey | 99.9 /100 | #35 | Exceptional 65.2% |
| Immigrants | South Africa | 99.9 /100 | #36 | Exceptional 65.1% |
| Russians | 99.9 /100 | #37 | Exceptional 65.1% |
| Immigrants | Saudi Arabia | 99.9 /100 | #38 | Exceptional 65.0% |
| Estonians | 99.9 /100 | #39 | Exceptional 65.0% |
| Immigrants | Kuwait | 99.9 /100 | #40 | Exceptional 65.0% |
| Mongolians | 99.9 /100 | #41 | Exceptional 64.8% |
| Immigrants | Latvia | 99.9 /100 | #42 | Exceptional 64.8% |
| Immigrants | Russia | 99.9 /100 | #43 | Exceptional 64.7% |
| Immigrants | Norway | 99.9 /100 | #44 | Exceptional 64.7% |
| Immigrants | Lithuania | 99.9 /100 | #45 | Exceptional 64.6% |
| Bhutanese | 99.9 /100 | #46 | Exceptional 64.6% |
| Australians | 99.9 /100 | #47 | Exceptional 64.6% |
| Immigrants | Bulgaria | 99.9 /100 | #48 | Exceptional 64.6% |
Demographics Similar to Uruguayans by College, 1 year or more
In terms of college, 1 year or more, the demographic groups most similar to Uruguayans are Immigrants from Cameroon (58.8%, a difference of 0.040%), French (58.9%, a difference of 0.15%), German (58.9%, a difference of 0.17%), Immigrants from Philippines (58.7%, a difference of 0.17%), and Scotch-Irish (58.9%, a difference of 0.18%).
| Demographics | Rating | Rank | College, 1 year or more |
| Immigrants | Bosnia and Herzegovina | 42.8 /100 | #182 | Average 59.2% |
| German Russians | 39.3 /100 | #183 | Fair 59.1% |
| Spaniards | 38.3 /100 | #184 | Fair 59.0% |
| South Americans | 35.9 /100 | #185 | Fair 59.0% |
| Scotch-Irish | 34.7 /100 | #186 | Fair 58.9% |
| Germans | 34.7 /100 | #187 | Fair 58.9% |
| French | 34.4 /100 | #188 | Fair 58.9% |
| Uruguayans | 31.8 /100 | #189 | Fair 58.8% |
| Immigrants | Cameroon | 31.2 /100 | #190 | Fair 58.8% |
| Immigrants | Philippines | 29.2 /100 | #191 | Fair 58.7% |
| Colombians | 27.6 /100 | #192 | Fair 58.7% |
| Peruvians | 27.5 /100 | #193 | Fair 58.6% |
| Costa Ricans | 26.4 /100 | #194 | Fair 58.6% |
| Dutch | 26.2 /100 | #195 | Fair 58.6% |
| Guamanians/Chamorros | 26.2 /100 | #196 | Fair 58.6% |