Yakama vs Immigrants from St. Vincent and the Grenadines 9th Grade
COMPARE
Yakama
Immigrants from St. Vincent and the Grenadines
9th Grade
9th Grade Comparison
Yakama
Immigrants from St. Vincent and the Grenadines
90.1%
9TH GRADE
0.0/ 100
METRIC RATING
339th/ 347
METRIC RANK
93.4%
9TH GRADE
0.0/ 100
METRIC RATING
287th/ 347
METRIC RANK
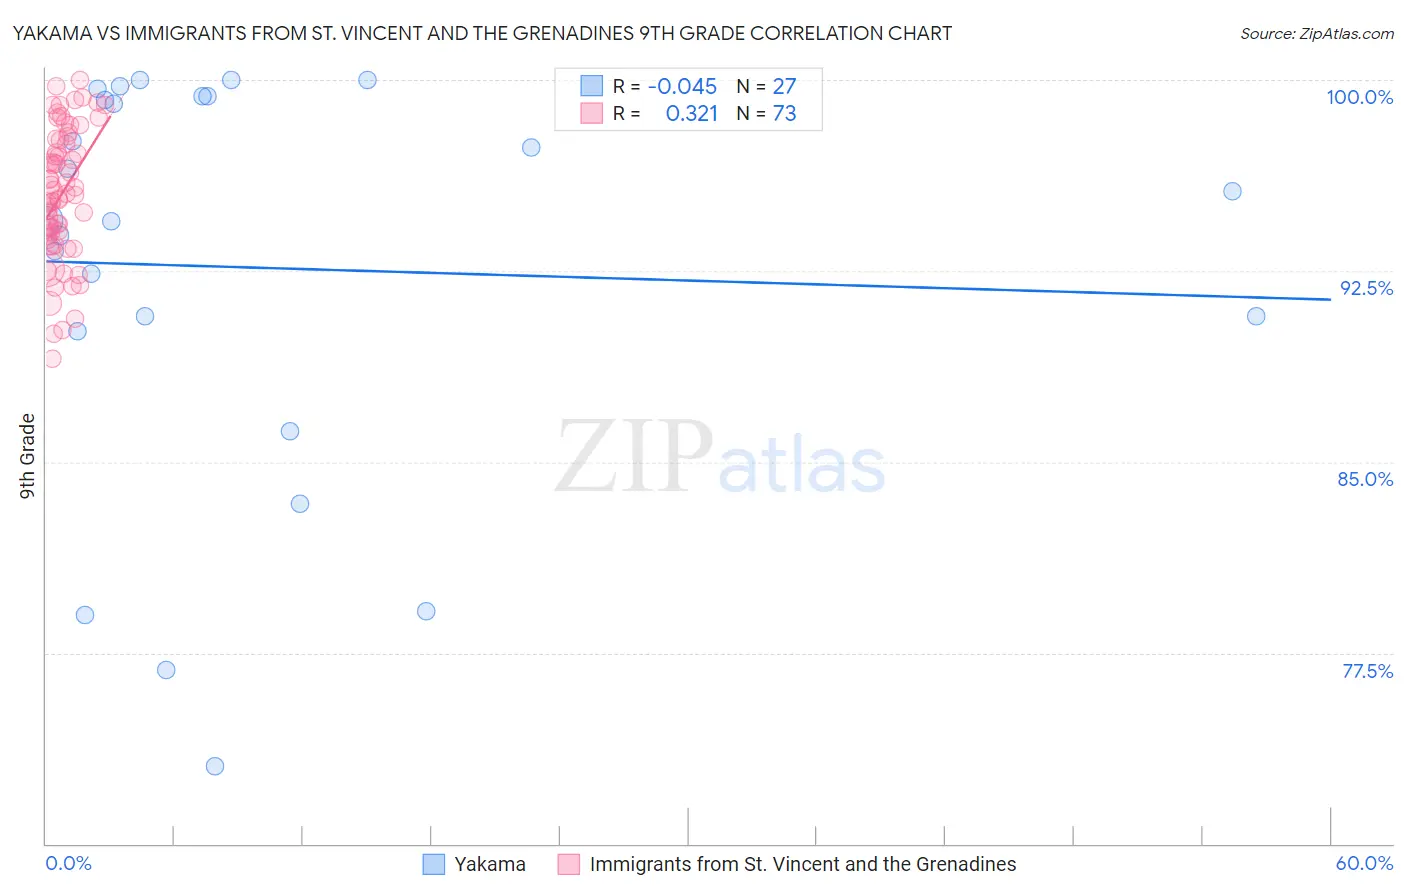
Yakama vs Immigrants from St. Vincent and the Grenadines 9th Grade Correlation Chart
The statistical analysis conducted on geographies consisting of 19,923,144 people shows no correlation between the proportion of Yakama and percentage of population with at least 9th grade education in the United States with a correlation coefficient (R) of -0.045 and weighted average of 90.1%. Similarly, the statistical analysis conducted on geographies consisting of 56,191,418 people shows a mild positive correlation between the proportion of Immigrants from St. Vincent and the Grenadines and percentage of population with at least 9th grade education in the United States with a correlation coefficient (R) of 0.321 and weighted average of 93.4%, a difference of 3.7%.
9th Grade Correlation Summary
| Measurement | Yakama | Immigrants from St. Vincent and the Grenadines |
| Minimum | 73.0% | 89.0% |
| Maximum | 100.0% | 100.0% |
| Range | 27.0% | 11.0% |
| Mean | 92.6% | 95.5% |
| Median | 94.5% | 95.5% |
| Interquartile 25% (IQ1) | 90.1% | 93.8% |
| Interquartile 75% (IQ3) | 99.3% | 97.7% |
| Interquartile Range (IQR) | 9.2% | 3.9% |
| Standard Deviation (Sample) | 8.0% | 2.6% |
| Standard Deviation (Population) | 7.8% | 2.6% |
Similar Demographics by 9th Grade
Demographics Similar to Yakama by 9th Grade
In terms of 9th grade, the demographic groups most similar to Yakama are Mexican (90.0%, a difference of 0.060%), Guatemalan (89.9%, a difference of 0.19%), Central American (90.4%, a difference of 0.34%), Immigrants from Latin America (90.4%, a difference of 0.35%), and Immigrants from Dominican Republic (90.5%, a difference of 0.47%).
| Demographics | Rating | Rank | 9th Grade |
| Hispanics or Latinos | 0.0 /100 | #332 | Tragic 90.9% |
| Immigrants | Yemen | 0.0 /100 | #333 | Tragic 90.8% |
| Immigrants | Azores | 0.0 /100 | #334 | Tragic 90.8% |
| Immigrants | Honduras | 0.0 /100 | #335 | Tragic 90.6% |
| Immigrants | Dominican Republic | 0.0 /100 | #336 | Tragic 90.5% |
| Immigrants | Latin America | 0.0 /100 | #337 | Tragic 90.4% |
| Central Americans | 0.0 /100 | #338 | Tragic 90.4% |
| Yakama | 0.0 /100 | #339 | Tragic 90.1% |
| Mexicans | 0.0 /100 | #340 | Tragic 90.0% |
| Guatemalans | 0.0 /100 | #341 | Tragic 89.9% |
| Salvadorans | 0.0 /100 | #342 | Tragic 89.6% |
| Immigrants | Guatemala | 0.0 /100 | #343 | Tragic 89.4% |
| Immigrants | El Salvador | 0.0 /100 | #344 | Tragic 89.0% |
| Immigrants | Central America | 0.0 /100 | #345 | Tragic 89.0% |
| Immigrants | Mexico | 0.0 /100 | #346 | Tragic 88.7% |
Demographics Similar to Immigrants from St. Vincent and the Grenadines by 9th Grade
In terms of 9th grade, the demographic groups most similar to Immigrants from St. Vincent and the Grenadines are Immigrants from Barbados (93.4%, a difference of 0.010%), Immigrants from South Eastern Asia (93.3%, a difference of 0.030%), Immigrants from Peru (93.4%, a difference of 0.040%), Bangladeshi (93.4%, a difference of 0.090%), and Immigrants from West Indies (93.3%, a difference of 0.090%).
| Demographics | Rating | Rank | 9th Grade |
| Taiwanese | 0.1 /100 | #280 | Tragic 93.6% |
| Immigrants | Trinidad and Tobago | 0.1 /100 | #281 | Tragic 93.6% |
| Malaysians | 0.0 /100 | #282 | Tragic 93.5% |
| Barbadians | 0.0 /100 | #283 | Tragic 93.5% |
| Bangladeshis | 0.0 /100 | #284 | Tragic 93.4% |
| Immigrants | Peru | 0.0 /100 | #285 | Tragic 93.4% |
| Immigrants | Barbados | 0.0 /100 | #286 | Tragic 93.4% |
| Immigrants | St. Vincent and the Grenadines | 0.0 /100 | #287 | Tragic 93.4% |
| Immigrants | South Eastern Asia | 0.0 /100 | #288 | Tragic 93.3% |
| Immigrants | West Indies | 0.0 /100 | #289 | Tragic 93.3% |
| Pennsylvania Germans | 0.0 /100 | #290 | Tragic 93.3% |
| British West Indians | 0.0 /100 | #291 | Tragic 93.2% |
| Immigrants | Laos | 0.0 /100 | #292 | Tragic 93.2% |
| Sri Lankans | 0.0 /100 | #293 | Tragic 93.2% |
| Cubans | 0.0 /100 | #294 | Tragic 93.2% |