Yakama vs Ecuadorian 9th Grade
COMPARE
Yakama
Ecuadorian
9th Grade
9th Grade Comparison
Yakama
Ecuadorians
90.1%
9TH GRADE
0.0/ 100
METRIC RATING
339th/ 347
METRIC RANK
91.9%
9TH GRADE
0.0/ 100
METRIC RATING
319th/ 347
METRIC RANK
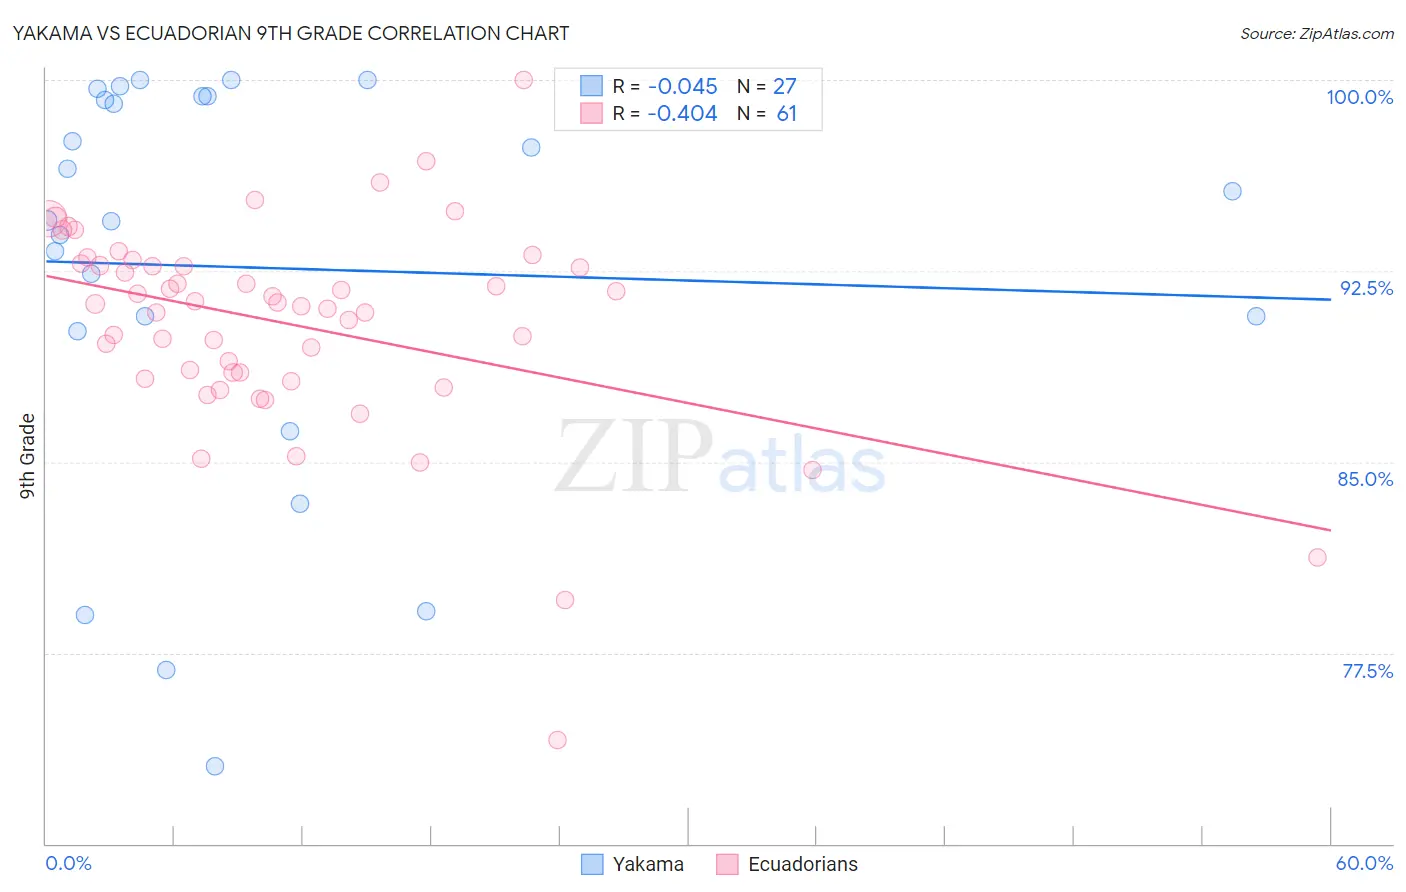
Yakama vs Ecuadorian 9th Grade Correlation Chart
The statistical analysis conducted on geographies consisting of 19,923,144 people shows no correlation between the proportion of Yakama and percentage of population with at least 9th grade education in the United States with a correlation coefficient (R) of -0.045 and weighted average of 90.1%. Similarly, the statistical analysis conducted on geographies consisting of 317,864,750 people shows a moderate negative correlation between the proportion of Ecuadorians and percentage of population with at least 9th grade education in the United States with a correlation coefficient (R) of -0.404 and weighted average of 91.9%, a difference of 2.1%.
9th Grade Correlation Summary
| Measurement | Yakama | Ecuadorian |
| Minimum | 73.0% | 74.1% |
| Maximum | 100.0% | 100.0% |
| Range | 27.0% | 25.9% |
| Mean | 92.6% | 90.4% |
| Median | 94.5% | 91.2% |
| Interquartile 25% (IQ1) | 90.1% | 88.4% |
| Interquartile 75% (IQ3) | 99.3% | 92.8% |
| Interquartile Range (IQR) | 9.2% | 4.4% |
| Standard Deviation (Sample) | 8.0% | 4.1% |
| Standard Deviation (Population) | 7.8% | 4.1% |
Demographics Similar to Yakama and Ecuadorians by 9th Grade
In terms of 9th grade, the demographic groups most similar to Yakama are Central American (90.4%, a difference of 0.34%), Immigrants from Latin America (90.4%, a difference of 0.35%), Immigrants from Dominican Republic (90.5%, a difference of 0.47%), Immigrants from Honduras (90.6%, a difference of 0.60%), and Immigrants from the Azores (90.8%, a difference of 0.78%). Similarly, the demographic groups most similar to Ecuadorians are Nicaraguan (91.9%, a difference of 0.040%), Immigrants from Ecuador (91.8%, a difference of 0.11%), Belizean (91.8%, a difference of 0.13%), Puerto Rican (91.8%, a difference of 0.14%), and Immigrants from Belize (91.8%, a difference of 0.20%).
| Demographics | Rating | Rank | 9th Grade |
| Ecuadorians | 0.0 /100 | #319 | Tragic 91.9% |
| Nicaraguans | 0.0 /100 | #320 | Tragic 91.9% |
| Immigrants | Ecuador | 0.0 /100 | #321 | Tragic 91.8% |
| Belizeans | 0.0 /100 | #322 | Tragic 91.8% |
| Puerto Ricans | 0.0 /100 | #323 | Tragic 91.8% |
| Immigrants | Belize | 0.0 /100 | #324 | Tragic 91.8% |
| Central American Indians | 0.0 /100 | #325 | Tragic 91.5% |
| Immigrants | Armenia | 0.0 /100 | #326 | Tragic 91.4% |
| Immigrants | Nicaragua | 0.0 /100 | #327 | Tragic 91.3% |
| Dominicans | 0.0 /100 | #328 | Tragic 91.1% |
| Hondurans | 0.0 /100 | #329 | Tragic 91.0% |
| Immigrants | Cabo Verde | 0.0 /100 | #330 | Tragic 90.9% |
| Mexican American Indians | 0.0 /100 | #331 | Tragic 90.9% |
| Hispanics or Latinos | 0.0 /100 | #332 | Tragic 90.9% |
| Immigrants | Yemen | 0.0 /100 | #333 | Tragic 90.8% |
| Immigrants | Azores | 0.0 /100 | #334 | Tragic 90.8% |
| Immigrants | Honduras | 0.0 /100 | #335 | Tragic 90.6% |
| Immigrants | Dominican Republic | 0.0 /100 | #336 | Tragic 90.5% |
| Immigrants | Latin America | 0.0 /100 | #337 | Tragic 90.4% |
| Central Americans | 0.0 /100 | #338 | Tragic 90.4% |
| Yakama | 0.0 /100 | #339 | Tragic 90.1% |