Luxembourger vs Macedonian 9th Grade
COMPARE
Luxembourger
Macedonian
9th Grade
9th Grade Comparison
Luxembourgers
Macedonians
96.3%
9TH GRADE
100.0/ 100
METRIC RATING
33rd/ 347
METRIC RANK
96.0%
9TH GRADE
99.8/ 100
METRIC RATING
57th/ 347
METRIC RANK
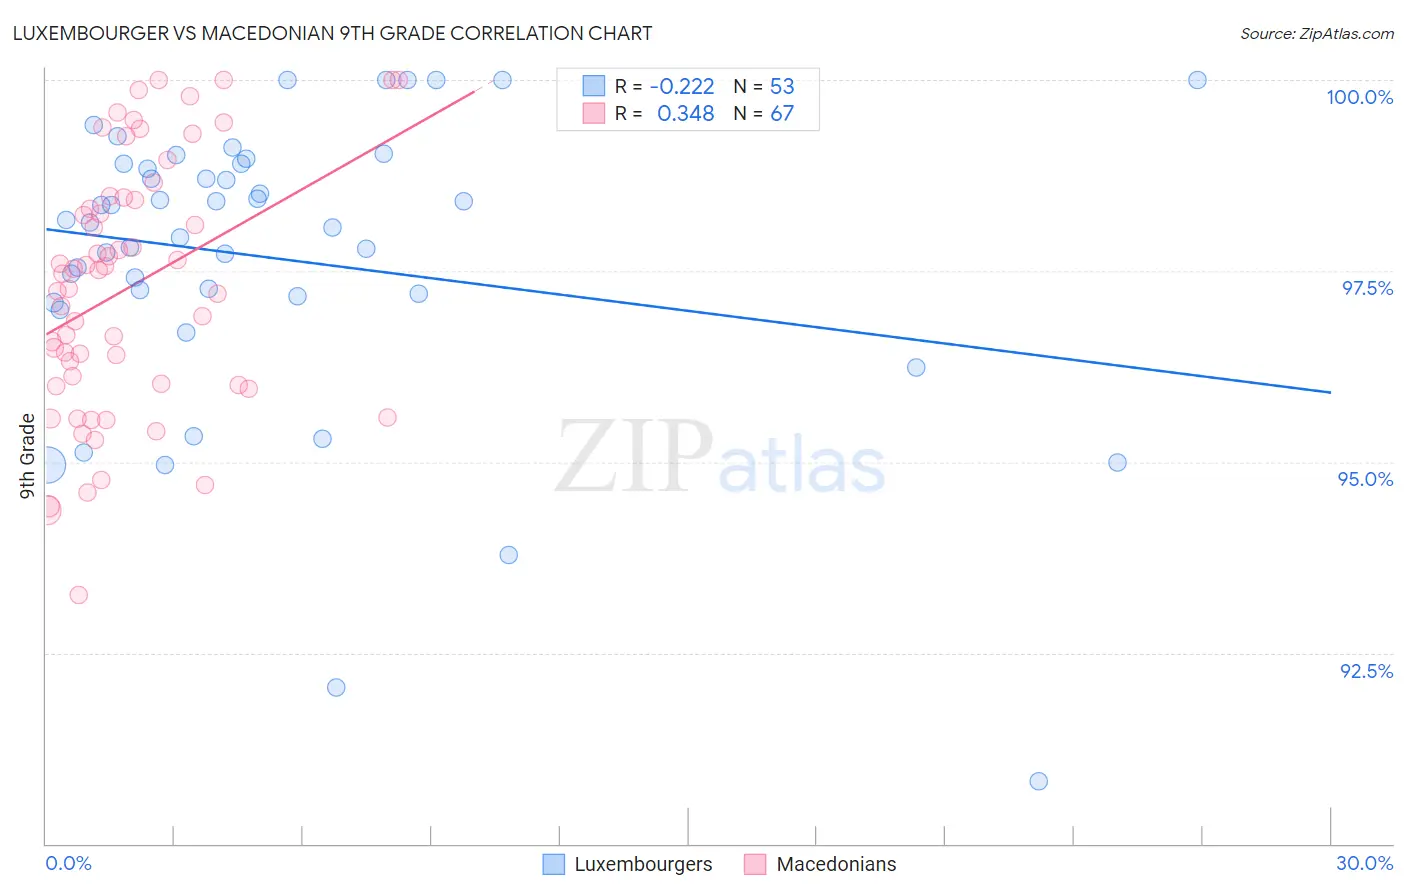
Luxembourger vs Macedonian 9th Grade Correlation Chart
The statistical analysis conducted on geographies consisting of 144,676,190 people shows a weak negative correlation between the proportion of Luxembourgers and percentage of population with at least 9th grade education in the United States with a correlation coefficient (R) of -0.222 and weighted average of 96.3%. Similarly, the statistical analysis conducted on geographies consisting of 132,581,663 people shows a mild positive correlation between the proportion of Macedonians and percentage of population with at least 9th grade education in the United States with a correlation coefficient (R) of 0.348 and weighted average of 96.0%, a difference of 0.30%.
9th Grade Correlation Summary
| Measurement | Luxembourger | Macedonian |
| Minimum | 90.8% | 93.3% |
| Maximum | 100.0% | 100.0% |
| Range | 9.2% | 6.7% |
| Mean | 97.7% | 97.3% |
| Median | 98.1% | 97.5% |
| Interquartile 25% (IQ1) | 97.1% | 96.0% |
| Interquartile 75% (IQ3) | 98.9% | 98.5% |
| Interquartile Range (IQR) | 1.8% | 2.5% |
| Standard Deviation (Sample) | 1.9% | 1.7% |
| Standard Deviation (Population) | 1.9% | 1.6% |
Similar Demographics by 9th Grade
Demographics Similar to Luxembourgers by 9th Grade
In terms of 9th grade, the demographic groups most similar to Luxembourgers are British (96.3%, a difference of 0.010%), Belgian (96.3%, a difference of 0.010%), Maltese (96.3%, a difference of 0.020%), Hungarian (96.2%, a difference of 0.030%), and Chinese (96.3%, a difference of 0.040%).
| Demographics | Rating | Rank | 9th Grade |
| French Canadians | 100.0 /100 | #26 | Exceptional 96.3% |
| Scotch-Irish | 100.0 /100 | #27 | Exceptional 96.3% |
| Eastern Europeans | 100.0 /100 | #28 | Exceptional 96.3% |
| Chinese | 100.0 /100 | #29 | Exceptional 96.3% |
| Maltese | 100.0 /100 | #30 | Exceptional 96.3% |
| British | 100.0 /100 | #31 | Exceptional 96.3% |
| Belgians | 100.0 /100 | #32 | Exceptional 96.3% |
| Luxembourgers | 100.0 /100 | #33 | Exceptional 96.3% |
| Hungarians | 100.0 /100 | #34 | Exceptional 96.2% |
| Bulgarians | 99.9 /100 | #35 | Exceptional 96.2% |
| Northern Europeans | 99.9 /100 | #36 | Exceptional 96.2% |
| Estonians | 99.9 /100 | #37 | Exceptional 96.1% |
| Immigrants | Scotland | 99.9 /100 | #38 | Exceptional 96.1% |
| Ottawa | 99.9 /100 | #39 | Exceptional 96.1% |
| Slavs | 99.9 /100 | #40 | Exceptional 96.1% |
Demographics Similar to Macedonians by 9th Grade
In terms of 9th grade, the demographic groups most similar to Macedonians are Aleut (96.0%, a difference of 0.0%), Immigrants from Austria (96.0%, a difference of 0.010%), Immigrants from North America (96.0%, a difference of 0.010%), New Zealander (95.9%, a difference of 0.020%), and Immigrants from Canada (96.0%, a difference of 0.030%).
| Demographics | Rating | Rank | 9th Grade |
| Celtics | 99.9 /100 | #50 | Exceptional 96.0% |
| Immigrants | Northern Europe | 99.9 /100 | #51 | Exceptional 96.0% |
| Serbians | 99.9 /100 | #52 | Exceptional 96.0% |
| Austrians | 99.8 /100 | #53 | Exceptional 96.0% |
| Immigrants | Canada | 99.8 /100 | #54 | Exceptional 96.0% |
| Immigrants | Austria | 99.8 /100 | #55 | Exceptional 96.0% |
| Immigrants | North America | 99.8 /100 | #56 | Exceptional 96.0% |
| Macedonians | 99.8 /100 | #57 | Exceptional 96.0% |
| Aleuts | 99.8 /100 | #58 | Exceptional 96.0% |
| New Zealanders | 99.8 /100 | #59 | Exceptional 95.9% |
| Native Hawaiians | 99.8 /100 | #60 | Exceptional 95.9% |
| Sioux | 99.8 /100 | #61 | Exceptional 95.9% |
| Ukrainians | 99.7 /100 | #62 | Exceptional 95.9% |
| Canadians | 99.7 /100 | #63 | Exceptional 95.9% |
| Zimbabweans | 99.7 /100 | #64 | Exceptional 95.9% |