Immigrants from Trinidad and Tobago vs Macedonian 9th Grade
COMPARE
Immigrants from Trinidad and Tobago
Macedonian
9th Grade
9th Grade Comparison
Immigrants from Trinidad and Tobago
Macedonians
93.6%
9TH GRADE
0.1/ 100
METRIC RATING
281st/ 347
METRIC RANK
96.0%
9TH GRADE
99.8/ 100
METRIC RATING
57th/ 347
METRIC RANK
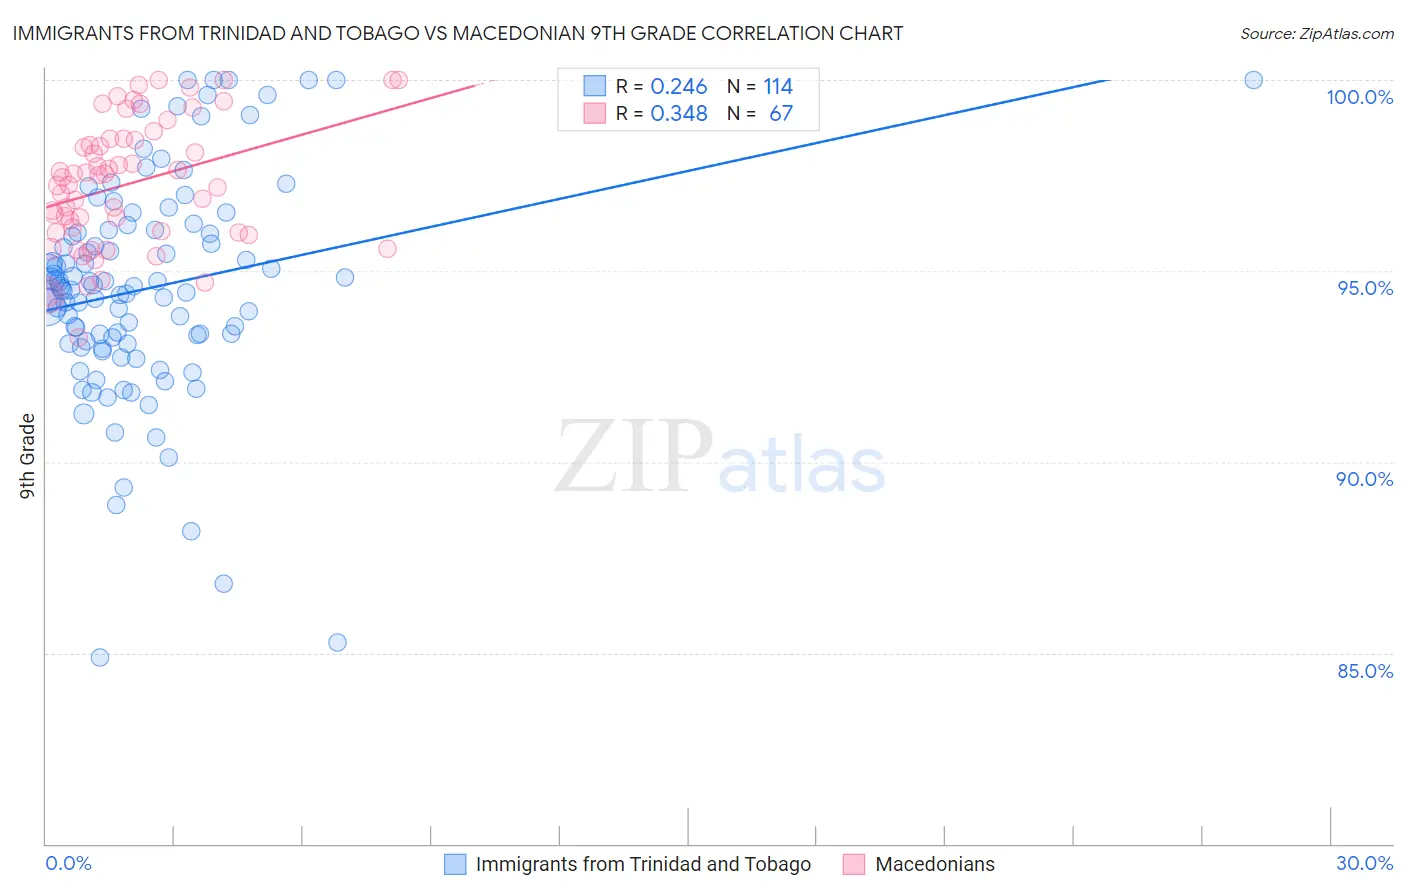
Immigrants from Trinidad and Tobago vs Macedonian 9th Grade Correlation Chart
The statistical analysis conducted on geographies consisting of 223,526,834 people shows a weak positive correlation between the proportion of Immigrants from Trinidad and Tobago and percentage of population with at least 9th grade education in the United States with a correlation coefficient (R) of 0.246 and weighted average of 93.6%. Similarly, the statistical analysis conducted on geographies consisting of 132,581,663 people shows a mild positive correlation between the proportion of Macedonians and percentage of population with at least 9th grade education in the United States with a correlation coefficient (R) of 0.348 and weighted average of 96.0%, a difference of 2.6%.
9th Grade Correlation Summary
| Measurement | Immigrants from Trinidad and Tobago | Macedonian |
| Minimum | 84.9% | 93.3% |
| Maximum | 100.0% | 100.0% |
| Range | 15.1% | 6.7% |
| Mean | 94.5% | 97.3% |
| Median | 94.6% | 97.5% |
| Interquartile 25% (IQ1) | 93.1% | 96.0% |
| Interquartile 75% (IQ3) | 96.1% | 98.5% |
| Interquartile Range (IQR) | 3.0% | 2.5% |
| Standard Deviation (Sample) | 2.9% | 1.7% |
| Standard Deviation (Population) | 2.9% | 1.6% |
Similar Demographics by 9th Grade
Demographics Similar to Immigrants from Trinidad and Tobago by 9th Grade
In terms of 9th grade, the demographic groups most similar to Immigrants from Trinidad and Tobago are Taiwanese (93.6%, a difference of 0.040%), Malaysian (93.5%, a difference of 0.050%), Barbadian (93.5%, a difference of 0.070%), Trinidadian and Tobagonian (93.7%, a difference of 0.12%), and Bangladeshi (93.4%, a difference of 0.14%).
| Demographics | Rating | Rank | 9th Grade |
| Peruvians | 0.2 /100 | #274 | Tragic 93.8% |
| Immigrants | Colombia | 0.2 /100 | #275 | Tragic 93.8% |
| West Indians | 0.2 /100 | #276 | Tragic 93.7% |
| Immigrants | Philippines | 0.1 /100 | #277 | Tragic 93.7% |
| Immigrants | Eritrea | 0.1 /100 | #278 | Tragic 93.7% |
| Trinidadians and Tobagonians | 0.1 /100 | #279 | Tragic 93.7% |
| Taiwanese | 0.1 /100 | #280 | Tragic 93.6% |
| Immigrants | Trinidad and Tobago | 0.1 /100 | #281 | Tragic 93.6% |
| Malaysians | 0.0 /100 | #282 | Tragic 93.5% |
| Barbadians | 0.0 /100 | #283 | Tragic 93.5% |
| Bangladeshis | 0.0 /100 | #284 | Tragic 93.4% |
| Immigrants | Peru | 0.0 /100 | #285 | Tragic 93.4% |
| Immigrants | Barbados | 0.0 /100 | #286 | Tragic 93.4% |
| Immigrants | St. Vincent and the Grenadines | 0.0 /100 | #287 | Tragic 93.4% |
| Immigrants | South Eastern Asia | 0.0 /100 | #288 | Tragic 93.3% |
Demographics Similar to Macedonians by 9th Grade
In terms of 9th grade, the demographic groups most similar to Macedonians are Aleut (96.0%, a difference of 0.0%), Immigrants from Austria (96.0%, a difference of 0.010%), Immigrants from North America (96.0%, a difference of 0.010%), New Zealander (95.9%, a difference of 0.020%), and Immigrants from Canada (96.0%, a difference of 0.030%).
| Demographics | Rating | Rank | 9th Grade |
| Celtics | 99.9 /100 | #50 | Exceptional 96.0% |
| Immigrants | Northern Europe | 99.9 /100 | #51 | Exceptional 96.0% |
| Serbians | 99.9 /100 | #52 | Exceptional 96.0% |
| Austrians | 99.8 /100 | #53 | Exceptional 96.0% |
| Immigrants | Canada | 99.8 /100 | #54 | Exceptional 96.0% |
| Immigrants | Austria | 99.8 /100 | #55 | Exceptional 96.0% |
| Immigrants | North America | 99.8 /100 | #56 | Exceptional 96.0% |
| Macedonians | 99.8 /100 | #57 | Exceptional 96.0% |
| Aleuts | 99.8 /100 | #58 | Exceptional 96.0% |
| New Zealanders | 99.8 /100 | #59 | Exceptional 95.9% |
| Native Hawaiians | 99.8 /100 | #60 | Exceptional 95.9% |
| Sioux | 99.8 /100 | #61 | Exceptional 95.9% |
| Ukrainians | 99.7 /100 | #62 | Exceptional 95.9% |
| Canadians | 99.7 /100 | #63 | Exceptional 95.9% |
| Zimbabweans | 99.7 /100 | #64 | Exceptional 95.9% |