Blackfeet vs Macedonian 9th Grade
COMPARE
Blackfeet
Macedonian
9th Grade
9th Grade Comparison
Blackfeet
Macedonians
95.0%
9TH GRADE
62.6/ 100
METRIC RATING
165th/ 347
METRIC RANK
96.0%
9TH GRADE
99.8/ 100
METRIC RATING
57th/ 347
METRIC RANK
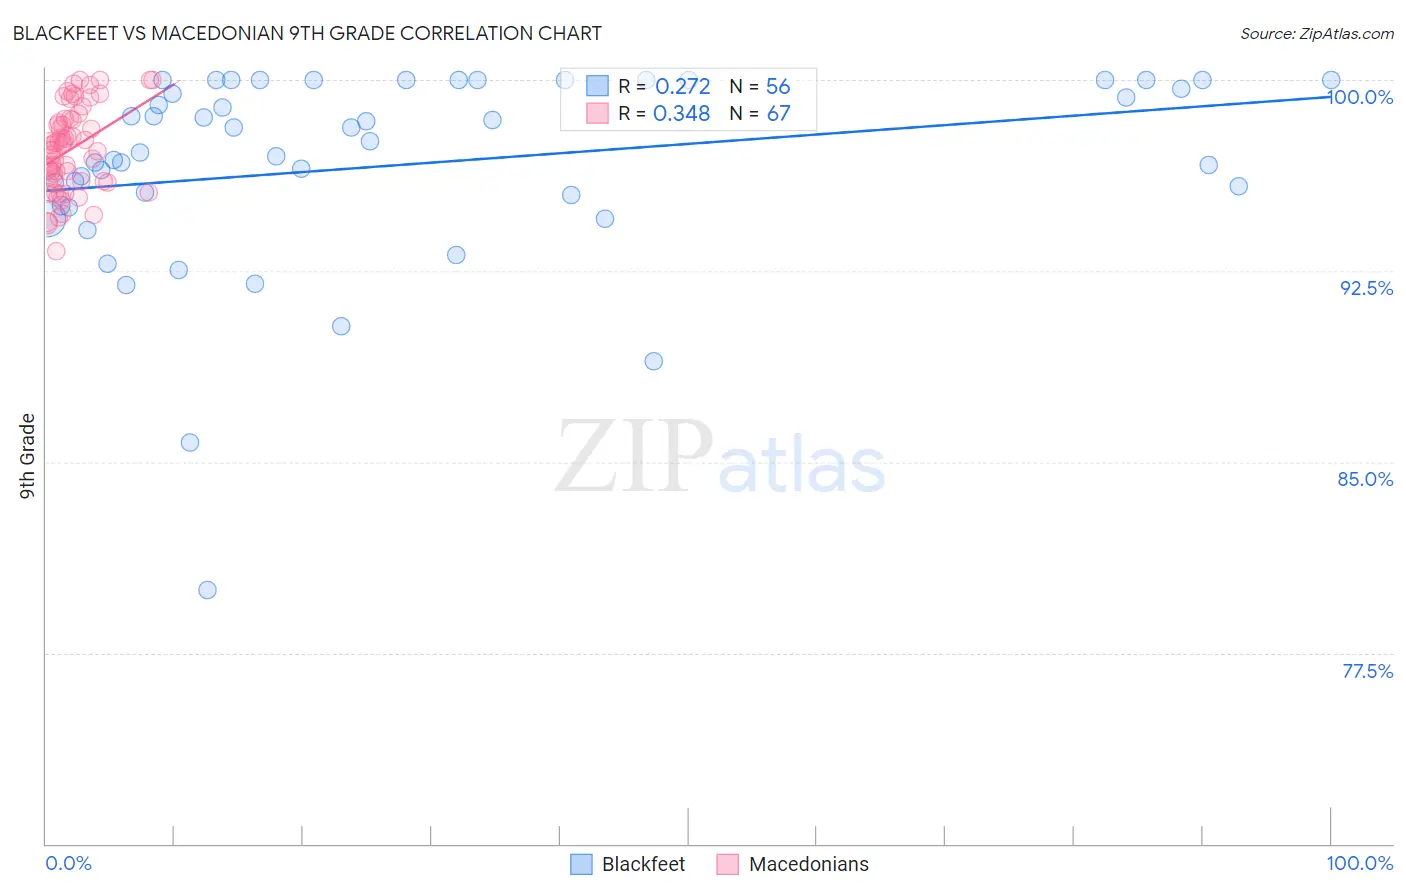
Blackfeet vs Macedonian 9th Grade Correlation Chart
The statistical analysis conducted on geographies consisting of 309,582,133 people shows a weak positive correlation between the proportion of Blackfeet and percentage of population with at least 9th grade education in the United States with a correlation coefficient (R) of 0.272 and weighted average of 95.0%. Similarly, the statistical analysis conducted on geographies consisting of 132,581,663 people shows a mild positive correlation between the proportion of Macedonians and percentage of population with at least 9th grade education in the United States with a correlation coefficient (R) of 0.348 and weighted average of 96.0%, a difference of 1.1%.
9th Grade Correlation Summary
| Measurement | Blackfeet | Macedonian |
| Minimum | 80.0% | 93.3% |
| Maximum | 100.0% | 100.0% |
| Range | 20.0% | 6.7% |
| Mean | 96.7% | 97.3% |
| Median | 97.4% | 97.5% |
| Interquartile 25% (IQ1) | 95.3% | 96.0% |
| Interquartile 75% (IQ3) | 100.0% | 98.5% |
| Interquartile Range (IQR) | 4.7% | 2.5% |
| Standard Deviation (Sample) | 3.9% | 1.7% |
| Standard Deviation (Population) | 3.9% | 1.6% |
Similar Demographics by 9th Grade
Demographics Similar to Blackfeet by 9th Grade
In terms of 9th grade, the demographic groups most similar to Blackfeet are Ute (95.0%, a difference of 0.0%), Pakistani (95.0%, a difference of 0.010%), Venezuelan (95.0%, a difference of 0.010%), Immigrants from Brazil (95.0%, a difference of 0.010%), and Chilean (95.0%, a difference of 0.020%).
| Demographics | Rating | Rank | 9th Grade |
| Egyptians | 70.1 /100 | #158 | Good 95.0% |
| Immigrants | Ukraine | 67.4 /100 | #159 | Good 95.0% |
| Immigrants | Italy | 66.6 /100 | #160 | Good 95.0% |
| French American Indians | 66.5 /100 | #161 | Good 95.0% |
| Bermudans | 65.8 /100 | #162 | Good 95.0% |
| Pakistanis | 64.1 /100 | #163 | Good 95.0% |
| Venezuelans | 63.6 /100 | #164 | Good 95.0% |
| Blackfeet | 62.6 /100 | #165 | Good 95.0% |
| Ute | 62.6 /100 | #166 | Good 95.0% |
| Immigrants | Brazil | 61.1 /100 | #167 | Good 95.0% |
| Chileans | 60.7 /100 | #168 | Good 95.0% |
| Spaniards | 59.6 /100 | #169 | Average 94.9% |
| Alsatians | 58.6 /100 | #170 | Average 94.9% |
| Colville | 58.5 /100 | #171 | Average 94.9% |
| Iraqis | 54.0 /100 | #172 | Average 94.9% |
Demographics Similar to Macedonians by 9th Grade
In terms of 9th grade, the demographic groups most similar to Macedonians are Aleut (96.0%, a difference of 0.0%), Immigrants from Austria (96.0%, a difference of 0.010%), Immigrants from North America (96.0%, a difference of 0.010%), New Zealander (95.9%, a difference of 0.020%), and Immigrants from Canada (96.0%, a difference of 0.030%).
| Demographics | Rating | Rank | 9th Grade |
| Celtics | 99.9 /100 | #50 | Exceptional 96.0% |
| Immigrants | Northern Europe | 99.9 /100 | #51 | Exceptional 96.0% |
| Serbians | 99.9 /100 | #52 | Exceptional 96.0% |
| Austrians | 99.8 /100 | #53 | Exceptional 96.0% |
| Immigrants | Canada | 99.8 /100 | #54 | Exceptional 96.0% |
| Immigrants | Austria | 99.8 /100 | #55 | Exceptional 96.0% |
| Immigrants | North America | 99.8 /100 | #56 | Exceptional 96.0% |
| Macedonians | 99.8 /100 | #57 | Exceptional 96.0% |
| Aleuts | 99.8 /100 | #58 | Exceptional 96.0% |
| New Zealanders | 99.8 /100 | #59 | Exceptional 95.9% |
| Native Hawaiians | 99.8 /100 | #60 | Exceptional 95.9% |
| Sioux | 99.8 /100 | #61 | Exceptional 95.9% |
| Ukrainians | 99.7 /100 | #62 | Exceptional 95.9% |
| Canadians | 99.7 /100 | #63 | Exceptional 95.9% |
| Zimbabweans | 99.7 /100 | #64 | Exceptional 95.9% |